Effect of weather on voter turnout in elections in Slovakia during the period 1994-2019
Marek Kučera
Sládkovičova 1048/38 Detva, 96212, Slovakia; email: marekkucera556@gmail.com, OCRID: 0000-0002-7798-3581
ABSTRACT
The presented paper evaluates voter turnout in relation to 17 meteorological elements in Slovakia over the period 1994-2019 during all national election events. 50 election days with different types of elections are considered. The Catalog of synoptical situations by Bradka is used and selected seasons are compiled into categories, where the Index of voter turnout (IF) is correlated with meteorological elements. Spearman correlation ranks were verified by tests of statistical significance (at level 0.10) and summary statistics from over 100-thousands possible combinations (categories) according to cyclonicity and season were compiled. A negative effect on turnout (in accordance with other authors) was found for higher precipitation and for higher temperatures (not fully in agreement with other authors). The negative effect of humidex, the positive effect of wind and the mostly positive effect of sunlight were confirmed, whereas the Arctic Oscillation (AO) confirmed the positive effect of negative phases with cyclonic weather and the snow cover the positive effect on turnout. Certain categories of elections, which are most prone to non-participation of potential voters with lower sense of public duty were established.
Keywords: elections, weather, meteorological elements, cyclonality, seasonality, Index of voter turnout, Slovakia
1 Introduction
Weather plays an important role in determining the behavior of a person and therefore it may also impact electoral turnout. Unfavorable weather may cause lower turnout and can therefore influence the final outcome of any given election. The effect of weather on election turnout has been dealt so far mainly by American authors (e.g. Ludlum, 1984; Gomez, 2007; Fraga & Hersh, 2010). More recent studies come from European countries, for example from Sweden (Persson et al., 2014) and Spain (Artes, 2014).
Voter turnout is a result of several factors acting on both an individual and a social level. Initial conditions are legally defined boundaries (e.g. age, date, the opportunity to vote outside one’s place of residence). The type of electoral system is also important (Ayres, 2006; Blais & Kess, 2006), and so is voter registration (Brians 2001; Hansford and Gomez, 2010) and the political system itself (Bernhager & Marsh, 2009; Blais et al., 2003; Borghesi et al., 2012 and others). In recent decades, voter turnout is decreasing worldwide, especially in the established democratic systems, because of the loss of faith in government (Eijk et al., 2011). Cultural and institutional background plays a certain role too (Powell, 1986; Hagan, 2006; Kavanagh, 2009; Madleňák, 2010), as well as the frequency of elections and the geographic accessibility of polling stations (Johnson, 1991). The electoral campaign is also affected by social and demographic factors, such as religion (Casanova, 2005; Froese, 2014, and others), ethnicity (Bevelander 2010; Ansolabehere et al., 2012, and others), gender (eg. Jones, 2004), and economic status of the voter (eg. Gerber & Rogers 2009; Chavarria, 2014). Other areas that are in the forefront of recent behavioral research are apathy (eg. Agaibe, 2015), rational choice (eg. Aldrich, 1993; Blais, 2000; Edlin et al., 2007; Feddersen, 2004), and motivation (e.g. Bryan et al., 2012).
Several researches and written submissions suggest that moving elections to the weekend could have a positive impact on voter engagement (Ministry of Justice, 2010). In the USA, it is a tradition since 1845 that federal elections be held on the first Tuesday of the month. However, in connection with the new findings of the United States Government Accountability Office (GAO, 2012), the US is also considering amending the law so that elections can be held on Saturdays, since Saturday is the world’s most frequent day of election week, thanks to the highest efficiency in achieving higher participation in elections, especially in democratic countries with a declining turnout. While older people in the United States are more in favor of staying on election Tuesday, younger people were found to have higher turnout intention and a willingness to go to the polls over the weekend.
Ludlum (1984) has already postulated that weather was decisive in presidential elections. In 1960, John F. Kenedy defeated Richard Nixon by only 112,827 votes, possibly because rain in the United States caused lower participation in the areas inhabited by republicans (Bassi, 2013). A recent study (Horiuchi et. Al, 2017) found that rainfall increased Republican vote shares, because it decreased turnout more among Democratic than among Republican voters (when democratic-leaning northeast is hit by rain, fewer democratic voters are going to vote).
According to recent studies (Bassi, 2013; Gatrell & Bierly, 2002, Horiuchi & Kang, 2015 and others) more precipitation during the election day results in lower voter turnout. Persson et al. (2014) found that one inch of rain (25.4 mm) reduced voter turnout by 0.413% in Sweden. In the USA it was established that an increase of one inch of rain means a 0.98% decrease of voter turnout in presidential elections (Gomez et al., 2007). Similarly, Artes (2014) reported a decrease in participation in elections in Spain due to rain. Madestam et al., 2013 even confirms the influence of weather on turnout through mediated protests, when adverse weather affects turnout. Fujiwara et al. (2016) have found that rainfall on current and past election days reduces voter turnout.
Similar patterns have been identified in Germany (more in favor of conservative voters; Arnold & Freier, 2016) or Canada (negative rainfall effect, positive high temperature effect, albeit depending on the season; Stockemer & Wigginton, 2018). Van Assche et al. (2017) have found that for every 1 ° C (1.8 ° F) increase in temperature in a state, voter turnout in US was boosted by 0.14%.
Weather impact on voter turnout has been attributed to change of mood in the population. Bassi (2013) concluded that adverse weather caused worse mood in most of the population. Similarly good mood was associated with lower humidity (Sanders & Brizzolara, 1982), high levels of solar radiation (Parrot & Sabini, 1990), high barometric pressure (Goldstein, 1972) and high temperatures (Cunningham, 1979). The effect of solar radiation was strongest in spring (Keller et al., 2005).
To some extent, extreme weather events such as tornadoes or hurricanes and their impact on election results were considered by Healy & Malhotra (2010) and Lasala-Blanco et al. (2017).
In this work we deal with voter turnout in elections in Slovakia, Central Europe. Slovakia is located in the temperate climate zone and in the transitional zone between maritime and continental climate. Most of its area is located in the Western Carpathians, bordered by lowlands in the southwest and southeast of the country. Climate regions of Slovakia were described by Lapin et al. (2002). Weather conditions are characterized by meteorological elements, and also by types of atmospheric circulation, which can be described by various catalogs of synoptic types (e.g., Kučera & Pecho, 2014).
In this paper we use statistical methods to evaluate the relationship between voter turnout in various elections in Slovakia since its establishment in 1994 until 2019 with 17 meteorological elements in relation to seasonal variability and cyclonicity.
2 Data and Methods
Two types of data are used in the analysis: daily meteorological data (Chapter 2.1) and voter turnout data (Chapter 2.2). We have achieved an effective display of the relationship between them by using of the so-called correlation matrices and outputs derived from them (Chapter 2.3).
2.1 Meteorological data and their processing
Data from 17 meteorological elements (measured at meteorological station or computed by equation) and regional synoptic catalogue (by Bradka et al., 1961) were used in the analysis to determine anti- / cyclonicity.
2.1.1 Geographical distribution of meteorological data
The values of meteorological variables for election days (input variables for correlation analysis) for the whole of Slovakia were determined as averages from 10 (water vapor pressure), 14 (air pressure) and 15 (other meteorological elements) of representative automatic meteorological stations (Fig. And Table 1a, b, c; Basemap: Vidiani.com, 2019).
The stations were selected so that they be representative for the whole territory of Slovakia, considering its varied landform resulting in a number of different climatic regions (Fig. And Table 1d, Basemap: Atlas krajiny, 2002).
2.1.2 17 examined meteorological elements
The list of 17 investigated meteorological elements contains Fig. and Table 1c (these are average daily (24-hour) values). Meteorological elements were at stations of the Slovak Hydrometeorological Institute (SHMÚ) directly measured (P, PX, RH, TX, TN, TG, W, C, S, SC) or derived from them (e, DTR / SLP, WI, HI). Formulas based on the availability of variables in the dataset were used to calculate the derived elements. The daily values of NAOi and AOi were taken from the NOAA database (CPC NOAA, 2019) and are valid for the whole territory of Slovakia (Northern Hemisphere).
The P, PX, RH, W, C, S and SC data did not require any adjustments. For TX, TN, TG, e, WI and HI, the anomalies from the used long-term normal (in day running) 1988-2017 were decisive. In the case of stations 3, 6, 9, 12 and 15, the normals taken from the nearest station with very close harmonized normal values (Nitra (Veľké Janíkovce) – Podhájska; Prievidza – Bzovík; Žilina (Dolný Hričov) – Žilina; Liesek – Oravská Lesná were used. , Tisinec – Medzilaborce).
DTR was calculated using a simple formula:
DTR = TX-TN. [eq. 1]
The air pressure (PR) of some election days of the 3 highest stations was converted to SLP using altitude (MASL) and average daily temperature (TG) based on a formula (Negretti & Zambra, 1879):
SLP = (PR * (1 – ((0,0065 * MASL) / (TG + 0,0065 * MASL + 273,15))) ^ (- 5,257)). [eq. 2]
WI was determined based on equations (Siple & Passel, 1945):
WI = WI´-WI´´ [eq. 3]
WI´ = (SQRT (100V) + 10.45-W) * (33-TG), [eq. 4]
where WI´ = windchill in kilocalories per square meter of exposed flesh per hour, W = wind speed in meters per secondandT = daily average air temperature in ° C and WI´´ the windchill index value recalculated for the long-term temperature normal.
HI was determined using dew point temperature (Tdew) and average daily temperature (TG) as (Masterson & Richardson, 1979):
[eq. 5]
[eq. 6]
(for T> 0 ° C: c1 = 6.1078, c2 = 17.08085, c3 = 234.175; for T <0 ° C: c1 = 6.1078, c2 = 17.84362, c3 = 245.425; RH – average 24-hour humidity).
Derived values of e for 10 stations were provided by SHMÚ.
2.1.3 Circulation types and directional supertypes
One of the main criteria in the creation of meteorological categories (see Chapter 2.3.2) was the nature of election days with regard to their anti- / cyclonicity (two large groups of circulation types (CTs) according to whether it is anticyclonic (high pressure) or cyclonic (low pressure). In Slovakia, the synoptic catalog by Brádka et al. (1961) is widely used; it recognizes 28 CTs (Fig. and Table 2a, b). Every day is assigned to one of the CTs. The CTs are determined by the direction of flow, the position of centers of low and high pressure, and the position of atmospheric fronts and their movement. CTs can be divided, according to the wind direction, in 6 supertypes (Kučera a Pecho, 2014).
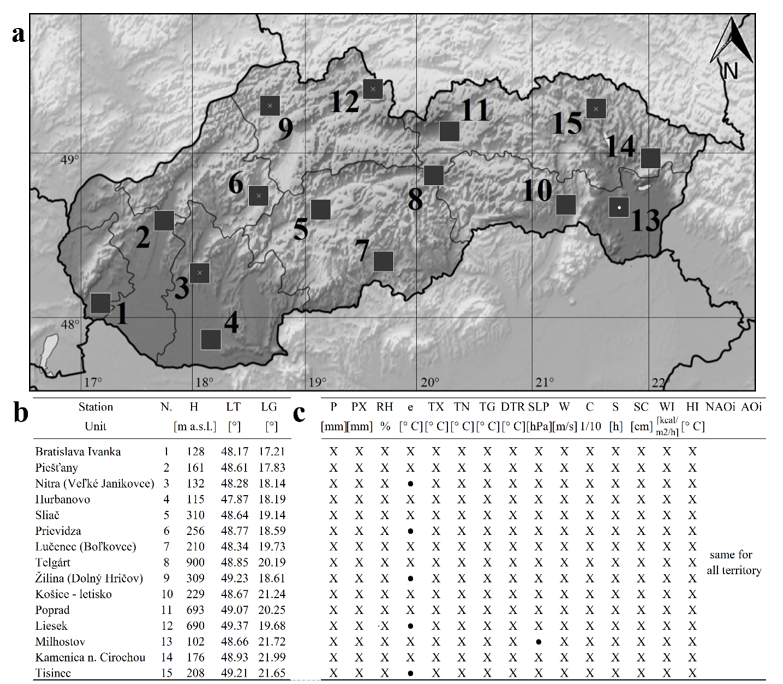
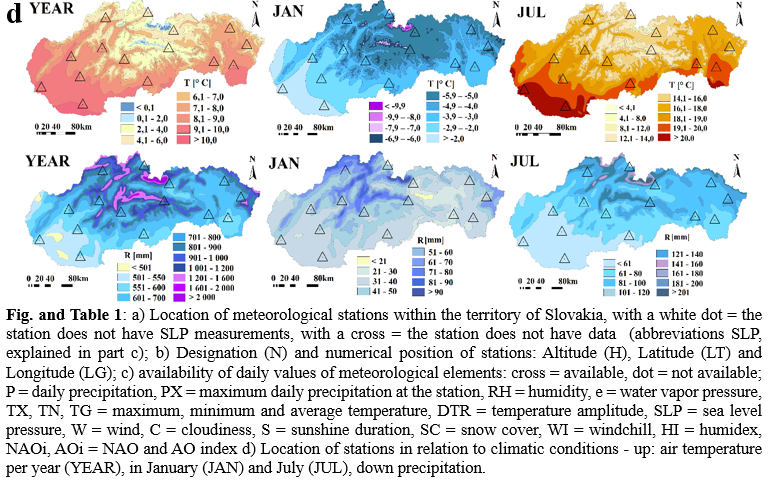
Fig. and Table 1: a) Location of meteorological stations within the territory of Slovakia, with a white dot = the station does not have SLP measurements, with a cross = the station does not have data (abbreviations SLP, explained in part c); b) Designation (N) and numerical position of stations: Altitude (H), Latitude (LT) and Longitude (LG); c) availability of daily values of meteorological elements: cross = available, dot = not available; P = daily precipitation, PX = maximum daily precipitation at the station, RH = humidity, e = water vapor pressure, TX, TN, TG = maximum, minimum and average temperature, DTR = temperature amplitude, SLP = sea level pressure, W = wind, C = cloudiness, S = sunshine duration, SC = snow cover, WI = windchill, HI = humidex, NAOi, AOi = NAO and AO index d) Location of stations in relation to climatic conditions – up: air temperature per year (YEAR), in January (JAN) and July (JUL), down precipitation.
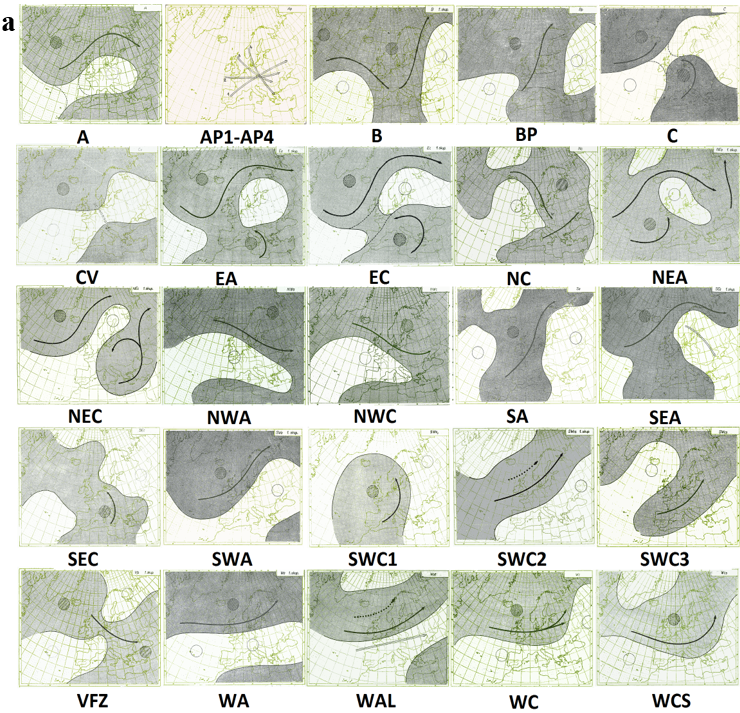
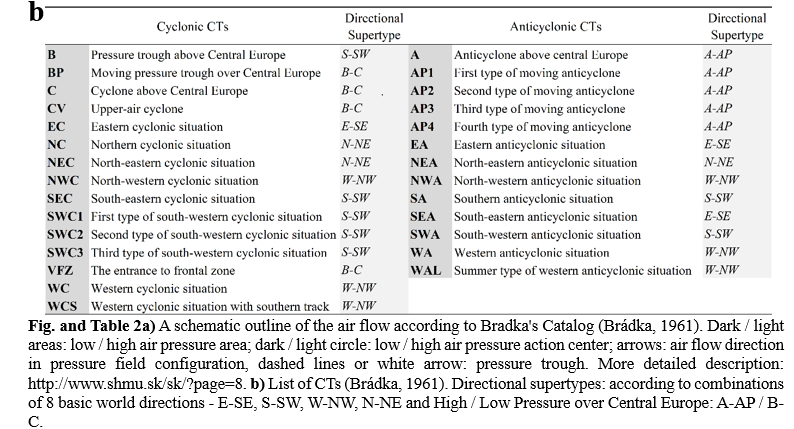
Fig. and Table 2a) A schematic outline of the air flow according to Bradka’s Catalog (Brádka, 1961). Dark / light areas: low / high air pressure area; dark / light circle: low / high air pressure action center; arrows: air flow direction in pressure field configuration, dashed lines or white arrow: pressure trough. More detailed description: http://www.shmu.sk/sk/?page=8. b) List of CTs (Brádka, 1961). Directional supertypes: according to combinations of 8 basic world directions – E-SE, S-SW, W-NW, N-NE and High / Low Pressure over Central Europe: A-AP / B-C.
2.2 Electoral data and processing thereof
In this chapter we clarified the political science terminology used, we described the calculation of the final index of voter turnout (IF) entering into correlation, analyzing and briefly summarizing 3 periods of electoral behavior between 1994 and 2019 in Slovakia.
2.2.1 Election events, election days and election categories
The fact that election events in the past used to take place during 2 days, or that election days were linked to referendums, needs to be clarified in relation to the terminology used.
An election event is a specific event lasting 1 or 2 election days. Especially in the past, 2-day election events were the norm. Since duration affects turnout, one- and two-day events were categorized separately.
Meteorological elements and turnout indices (Chapter 2.2.2) were calculated separately for each election day, with the fact that the elections were sometimes linked to referendums – so only 1 election day enters the analyzes.
Election categories represent selected types of elections (e.g. Presidential Round 1, Parliamentary, …). Turnout indices were calculated separately for these groups. We further divided the Election categories into 2 basic types: 1. / classic elections and 2. / referendums. The maximum range for voter turnout turnout was determined for each of the 2 groups. Based on the ratios of ranges, turnout indices were subsequently generated for each election category.
26 of the 33 election days took place on Saturday, 6 on Friday and 1 on Sunday. The turnout in terms of the Ministry of Justice (2010) and GAO (2012) after changes in the law at least since 2004 in Slovakia was probably maximized in this regard. We do not assume that the day of the week in the observed period had a significant effect on our results. IF for 6 Friday and 1 Sunday election day ranged from -0.15 to 0.44 (the arithmetic mean for IF is 0.22).
The list of election events, election days and election categories with the relevant electoral and meteorological characteristics is contained in Table 1.
2.2.2 Index of voter turnout
Election categories in the reviewed period were characterized by a different degree of electoral participation. While parliamentary elections reached 54.67 to 84.24% participation, elections to the European Parliament had only 13.05 to 19.64% partcipation. These are obviously not possible to compare due to large differences in voter turnout in different categories of elections. Therefore, we decided to set voter turnout at the same starting line using the Index of voter turnout, developed in this study and described below. Voter turnout indices (I, IO and IF) were derived from a simple percentage of the voter turnout.
In literature related to the issue of turnout depending on the weather, a similar index has not been introduced, yet. The procedure that we used in creating the index is associated with simple and widely used operations. We reached Final voter turnout index (detrended and calculated in respect to the differences in variation range and arithmetic mean between election categories), which we used in the correlation analysis (IF), was computed only after adjusting of two previous turnout indices: 1) Simple voter turnout percentile index (I) and 2) Original voter turnout index (IO).
The correlated IF with meteorological characteristics was thus adjusted to the form entering into correlation analyses, maximizing the obtained results. While I was only a common percentile of turnout within each election category ranging from 0 to 1 [eq. 7], IO already, compared to I, eliminated differences between variation ranges and arithmetic means within election categories. We achieved this by recalculating the values of I so that they range from -1 to 1, but the extreme values were achieved only in the category with the largest variation range [eq. 8]. Finally, IF corresponded to the detrended value of the IC:
I = (X-L) / (H-L) [eq. 7]
where H is the highest percentage of voter turnout within elections in selected election category, L is the lowest percentage of voter turnout within elections in selected election category; X is the participation in a selected election event.
Such a simple percentile index is often encountered in climatological as well as political science methodology (Alexander et al., 2006; Karl et al., 1999; Peterson et al., 2001; ECA & D, 2019; Howe, 2006; McNabb, 2010; Seljan, 2015 and others).
IO = = [eq. 8]
where R is the variation range of the voter turnout in elections in selected election category (group of elections), A is an arithmetic mean of the participation in all elections within the election category, Rmax is the maximally achieved variation range of the voter turnout within all election categories, and Amax is an arithmetic mean of voter turnouts of election category with a maximum variation range.
A simple index based on the variation range is the DTR itself (Alexander et al., 2006; Qu et al., 2014; Lauritsen and Rogers, 2012), in the case of IO such are variation ranges morevoer additionaly given to ratio.
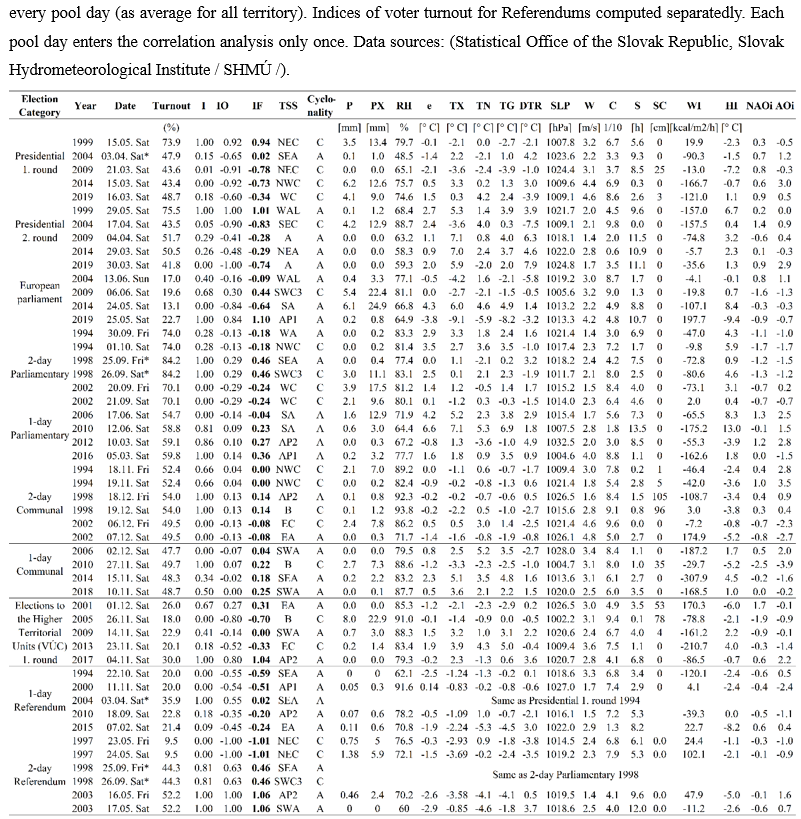
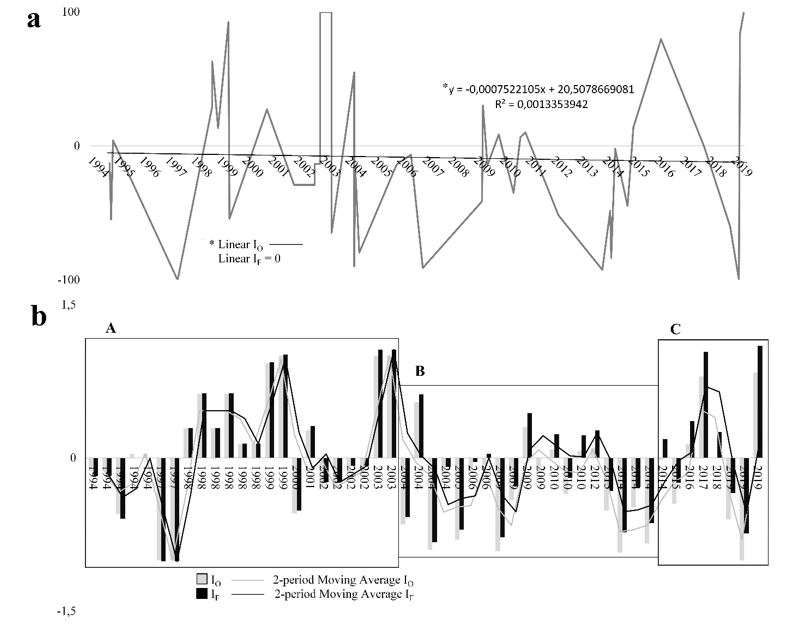
The decreasing time series trend was removed by linear regression analysis equation (* y; Fig. 1a). Detrending is a frequently used tool for maximizing outputs (Wu et al., 2007; Watson, 1986; Hamilton, 1994; Canova 1998; Mudelsee, 2010; Giese et al., 1999; Arnold, 2001; Cameron, 2005; Cogley and Nason, 1995b).
2.2.3 Changes in electoral behavior 1994-2019
Electoral behavior in Slovakia has followed the global trend of a general decline in interest in participating in elections in established democracies (e.g. Eijk et al., 2011). A development of electoral behavior in Slovakia in the observed period on the basis of IF can be described by 3 main periods with the predominant level of turnout (Fig. 1b).
The third period smoothed out the overall declining trend, which was removed from the time series. The time series of meteorological elements have not been detrended and the results reflect their direct impact on voter turnout.
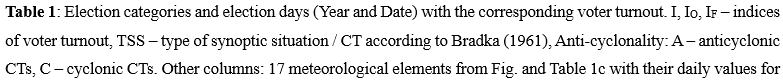
Table 1: Election categories and election days (Year and Date) with the corresponding voter turnout. I, IO, IF – indices of voter turnout, TSS – type of synoptic situation / CT according to Bradka (1961), Anti-cyclonality: A – anticyclonic CTs, C – cyclonic CTs. Other columns: 17 meteorological elements from Fig. and Table 1c with their daily values for every pool day (as average for all territory). Indices of voter turnout for Referendums computed separatedly. Each pool day enters the correlation analysis only once. Data sources: (Statistical Office of the Slovak Republic, Slovak Hydrometeorological Institute / SHMÚ /).
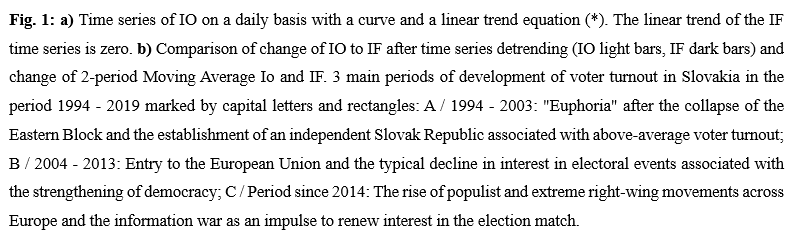
Fig. 1: a) Time series of IO on a daily basis with a curve and a linear trend equation (*). The linear trend of the IF time series is zero. b) Comparison of change of IO to IF after time series detrending (IO light bars, IF dark bars) and change of 2-period Moving Average Io and IF. 3 main periods of development of voter turnout in Slovakia in the period 1994 – 2019 marked by capital letters and rectangles: A / 1994 – 2003: “Euphoria” after the collapse of the Eastern Block and the establishment of an independent Slovak Republic associated with above-average voter turnout; B / 2004 – 2013: Entry to the European Union and the typical decline in interest in electoral events associated with the strengthening of democracy; C / Period since 2014: The rise of populist and extreme right-wing movements across Europe and the information war as an impulse to renew interest in the election match.
2.3. Analysis of the relationship between meteorological and electoral characteristics
The relationship between IF and 17 meteorological elements was finally tested by Spearman’s correlation coefficient and the results are presented in the form of matrices with coloured cells as significant correlation coefficients.
2.3.1 Statistical distribution of variables and Spearman rank correlation coefficient
Statistical distributions of variables are shown on Q-Q plots and their descriptive statistics are in Fig. 2-6. The relationship of the days with none or little precipitation with IF were not dealt with. Some variables (P, PX, W, S, SC) do not have a normal distribution according to the Shapiro-Wilk normality test (Shapiro and Wilk, 1965) or do not approach it (RH, e, TX, C, WI), so we decided use Spearman’s correlation coefficient for analysis for all variables (Sheskin, 2003; Conover, 1999).
2.3.2 Correlation matrix, meteorological categories and simplified outputs
The resulting database composed of meteorological and election data was finally divided into groups according to criteria (meteorological categories according to cyclonality, season and days above / below the 50th percentile of selected meteorological element). Within these groups, we correlated the IF turnout index with 17 meteorological elements separately for each meteorological category for the entire territory of the Slovak Republic.
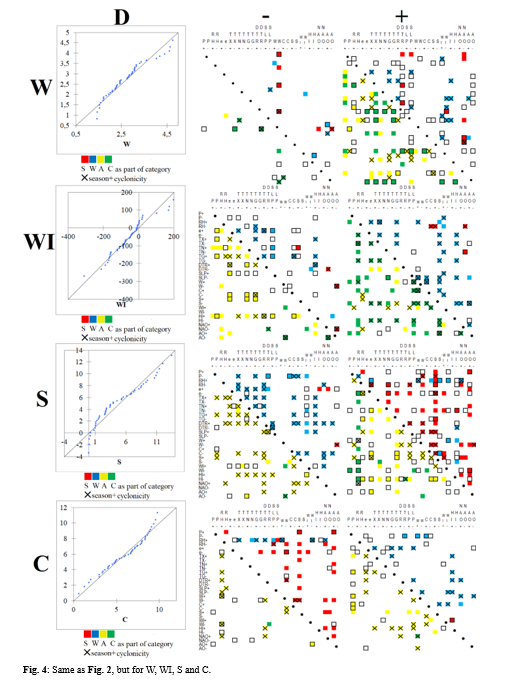
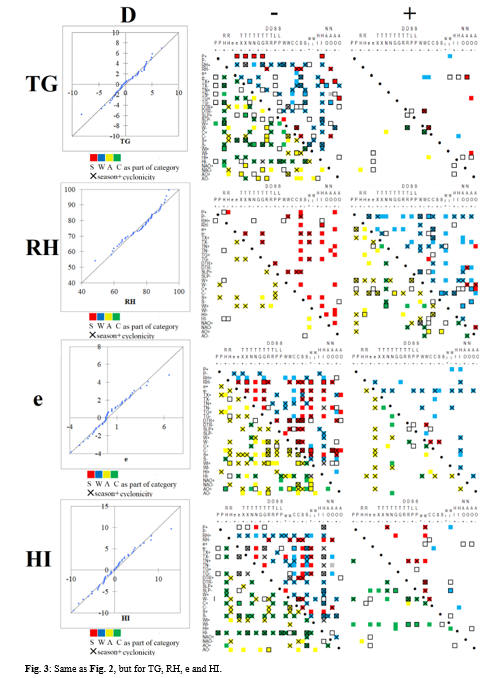
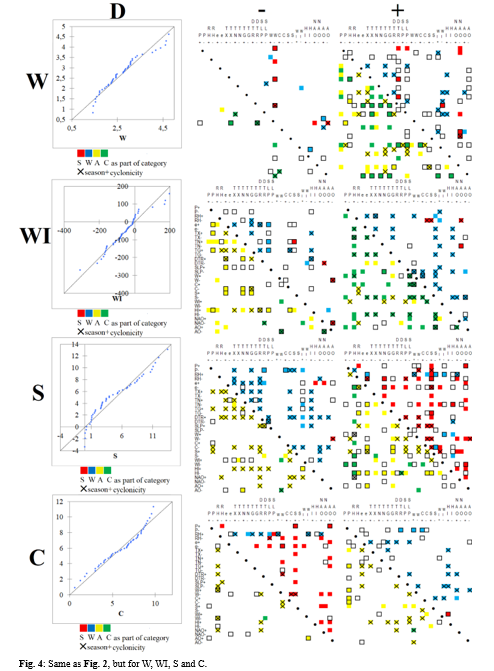
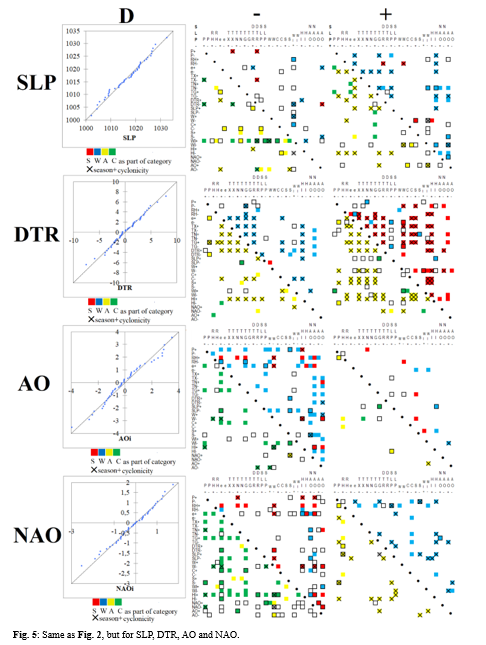
Due to the extensive research, we present the results in 17 matrixes (Fig. 2-6, each element has negative and positive responses) – these are generalizing outputs based on statistically significant responses. Combinations of narrower and wider summer and winter seasons (as „summer period“- 16th May to 15th September vs. „summer half-year“ – 16th April to 15th October / „winter period“ – 16th November to 15th March vs. „winter half-year“ – 16th October to 15th April) are shown in these outputs as the same category, although the results for them they were calculated separately (for a graphical representation of significance, it is sufficient if one alternative was statistically significant). The matrices then show overall pattern of the effect of the meteorological element on the turnout.
3 Results and Referring Discussion
In the following 8 subchapters, we have divided the meteorological elements into related groups and we try to describe the identified patterns of the influence of the weather on voter turnout in Slovakia. We discuss the results in relation to the findings of other authors so far.
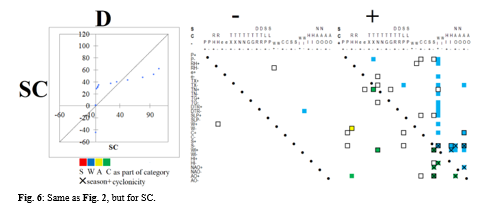
An overview of the statistical distribution of sets of 17 meteorological elements and 17 generalizing outputs from correlation analyzes is offered by Fig. 2 to Fig. 6. We present only combinations of meteorological elements with detected statistically significant responses (within all correlated meteorological categories) divided according to cyclonality, season and value above/below average of the given meteorological element (used abbreviations of elements are given in the title of the following subchapters).
3.1 Average precipitation (P) and maximum total precipitation (PX)
There are small differences between the Pa PX responses (Fig. 2). There are more positive responses in PX than in P. Negative correlations predominate significantly.
An adverse effect of precipitation according to the mechanism of unfavorable weather – adverse mood – non-participation in the election of potential voters (Knack, 1994, Bassi, 2013) has been confirmed in several countries (Gomez et al., 2007; Persson et al., 2014; Artes, 2014; Arnold & Freier, 2016; Stockemer & Wigginton, 2018). These are the 4 main weather groups with adverse effect of precipitation on voter turnout: winter cyclones (P+TG+SLP-W+C+S-WI-AO+), summer (storm) anticyclones P+RH-e-TX+TG+DTR+W-C-S+WI-HI+AO+), summer cyclones (P+TG+WI-AO+) and winter anticyclones with less precipitation (P+e-DTR+C-WI-HI-AO+). Selected winter situations also have a potential of TN-SLP+NAO+, summer e+TG-WI+NAO- and anticyclonic TN+.
A favorable effect was confirmed for summer cyclones (associated with weakening of heatwaves: P+TX-TG-DTR-WI+AO-) and winter anticyclones (RH-e+TX+TG+DTR+SLP-W+WI-HI+NAO+). Selected anticyclonic situations have a P- potential.
3.2 Maximum (TX), minimum (TN) and average (TG) daily temperatures
Negative responses predominate – within TX winter anticyclonic, within TN summer anticyclonic and within TG winter anticyclonic and cyclonic (Fig. 2 and Fig. 3).
Cunningham’s (1979) assumptions that higher temperatures bring better thermal comfort and thus can contribute to higher voter turnout (Bassi, 2013) have not been confirmed in Slovakia. The results are therefore in contrast to the equivalents of works from the USA, Canada or the Netherlands (Van Assche et al. 2017; Stockemer & Wigginton, 2018; Eisinga et al., 2012).
An adverse effect of high maximum temperature was confirmed in three possible combinations for winter anticyclones (e+TX+TG+DTR+W-WI+HI+AO+), summer anticyclones (RH-W-C-) and winter cyclones (S-WI+HI-), in selected anticyclonic situations s TN-SLP+S+WI-NAO-AO-, selected cyclonic situations with RH+W+. The favorable effect of high maximum temperature was confirmed only in selected winter (e-HI-) and summer (W-AO +) situations.
An adverse effect of high minimum temperature was confirmed especially in summer anticyclones (RH-e-TX-TN-TG-DTR+SLP+W-C-S+WI+HI-NAO-AO+AO-), less in summer cyclones (WI+), winter cyclones (TN+) and winter anticyclones (W+), selected cyclonic situations (DTR-S-) and selected summer situations (P +). A favorable effect of high minimum temperatures appears in winter with DTR-.
An adverse effect of high average temperature was confirmed for winter cyclones (RH+e-TX-TN+TN-TG-DTR-SLP-W+C+S-HI-), winter anticyclones (TX-TG-W-C-S+HI-) and summer anticyclone (RH-C-NAO-).
3.3 Humidity (RH), water vapor pressure (e) and humidex (HI)
There is an adverse effect of high humidity during summer anticyclones and favorable especially during winter anticyclones and cyclones, adverse effects of high water vapor pressure throughout the year, more in anticyclones and favorable during some winter situations and adverse effects of high humidex especially during summer anticyclonic and winter cyclonic situations and a favorable effect during some cyclonic situations, especially in summer (Fig. 3).
Sanders & Brizzolar’s claim, 1982, that good mood (and thus, according to Bassi, 2013, willingness to go to elect) is associated with lower humidity, were confirnmed within our findings only partially – for summer (stormy) anticyclones anticyklóny (e-TX-TG-SLP+S+WI+), or selected summer situations (P+RH-W+HI-AO+). The positive effects of humdit on voter turnout were confirmed almost exclusively in winter – probably due to the mitigation of the cold effect – especially for winter anticyclones anticyklón (P-e+TX+DTR+W+C-NAO+AO+), less winter cyclones (TN+WI+) and summer cyclones (NAO-) and during selected winter situations with e-TX-DTR-SLP+C+S-, summer with AO-, anticyclonic with RH-HI+ and cyclonic with W-.
In meteorology, the humidity characteristics describing the amount of water vapor in the air also include the water vapor pressure. It is the highest in dry and hot, and the lowest in cold Arctic air and mountainous areas. An adverse effect of high water vapor pressure was confirmed especially during summer anticyclonic situations (RH-e-TX-TN-TG-DTR+SLP+W-C-S+WI+HI-NAO-AO+AO-), less winter (warm) anticyclonal situations (P-RH+TX+TG+SLP+WI+HI-AO+) in summer cyclonic situations only in HI-AO+ and in winter cyclonic situations only in TN+C+S-HI-AO+. Winter configuration with W+HI+ is possible, too. A favorable effect of high water vapor pressure was confirmed in winter anticyclonic situations with e-TN-HI- and winter cyclonic situations with TN-, also selected winter situations with RH-W+C- and summer with W-.
Clearly stronger responses to adverse higher precipitation on turnout during above-average warm days may be related to a higher heat index during these situations and a more pronounced feeling of suffocation. According to Gaffen & Ross (1999), an increase in temperature and humidity (the highest near precipitation) upwards is associated with a deterioration in human thermal comfort. The calculation of temperature-humidity comfort for human activity has long been discussed by several authors (e.g., Steadman, 1979; Steadman 1994). Humidity and humidex are among the meteorological elements most influenced by the urban climate. Worse thermal comfort affects not only the apathy of voting (Bassi, 2013), but also human health – especially in urban areas (Hassid et al., 2000; Santamouris et al., 2001). Suffocating weather (high humidex) is unfavorable especially during winter cyclones with RH+e-TX-TN+TG-DTR-W+C+S-HI-AO+ and summer anticyclones with RH+e-TX-TN+TG-DTR-W+C+S-HI-AO+, less winter anticyclones (e-TX-TG-W-WI+NAO-) and summer cyclones (e-TX-TG-HI-) and selected anticyclones with AO-. A favorable effect of higher humidex was confirmed only near summer cyclones (TN +W-), or during selected cyclonic situations (P+TG+DTR-SLP-WI-).
3.4 Average wind speed (W) and windchill (WI)
Positive responses of average wind speed are significantly predominant, especially for winter anticyclonic, less winter cyclonic and summer anti-/cyclonic situations. The wind lowering a real-feel temperature is favorable especially for winter anticyclones and unfavorable for winter cyclones (Fig. 4).
Bos et al. (2012) confirmed the beneficial effect of wind (especially southwestern components) on mental health. Stronger winds, as our results show, are also favorable for higher voter turnout. The positive effect of stronger wind was confirmed especially (understandably) for winter anticyclones (with e+TX+TG+DTR+SLP-WI+WI-HI+), when the wind mostly increases the real-feel temperature and relieves frosts. Wind also has a positive effect on voter turnout within winter cyclones with SLP-WI+, summer anticyclones with P+NAO-, summer cyclones with P+DTR- and also selected cyclones with e-TX-TN-TG-AO- and selected anticyclones with TN+. A positive effect of weak winds was found only for summer cyclones with W-.
Stronger winds, unlike higher humidity, can uncomfortably reduce real-feel temperature (Osczevski & Bluestein, 2005). Our results showed that the negative effect of reduced real-feel temperature by wind is present especially within winter cyclonic situations (RH+e-TX-TG-W+C+S-HI-AO+), less so in winter anticyclones (TG-SLP-WI+) and summer cyclones (RH+) and also in selected cyclonic (P+TN-NAO) and anticyclonic (DTR-) situations. On the contrary, the positive effect of of reduced real-feel temperature by wind is evident for winter anticyclones (e+TX+TG+DTR+HI+) also selected anticyclones (P-RH+TN+C-S+), cyclones (NAO-) and winter situations (SLP+). While within winter cyclones these are below-average warm cloud situations, within winter anticyclones they are above-average situations with above-average sunshine.
3.5 Sunshine (S) and cloudiness (C)
An unfavorable effect of sunlight and a favorable effect of cloudiness during winter anticyclones were confirmed, and vice versa, favorable effect of sunlight and unfavorable effect of clouds during summer anticyclones (and less summer cyclones) (Fig. 4).
We hypothesize the positive effect of sunlight associated with good mood (Parrot & Sabini, 1990) for summer anticyclonic (RH-e-TN-TG-SLP+W-C-S+WI+), less winter anticyclonal (RH+HI-) and cyclonic situations (RH+), also for selected summer (P+DTR+NAO+AO+), winter (W+S-), anticyclonic (P-TX-) and cyclonic (WI-) situations. A negative effect of sunshine was found for winter anticyclonic situations (P-RH-e+TX+TN+TG+DTR+SLP+C-S+WI+NAO+) and selected winter situations (DTR-HI+), when clouds increase the temperature, and thus human thermal comfort (Cunningham, 1979).
Near cloudiness, responses are opposite and there are fewer – there is a positive effect during winter anticyclones (P-e+TX+TG+DTR+SLP-W+C+HI+), selected anticyclones (S+) and in winter (NAO+), and a negative effect during summer (especially anticyclones although responses for anticyclonicity are weaker: P+RH-e-SLP+W+S+NAO+AO+), summer anticyclones with W- and winter anticyclone with RH+DTR+.
3.6 Air Pressure (SLP) and Diurnal Temperature Range (DTR)
Positive responses of winter anticyclones predominate for SLP, positive responses of summer anticyclones for DTR and negative responses for winter anticyclones. Fewer winter anticyclonic and winter cyclonic negative responses were found for SLP (Fig. 5).
Most SLP responses are positive, so we can rather confirm the claims of Goldstein, 1972, who argued that good mood is associated with high barometric pressure. This is not entirely true for DTR, where larger DTR is favorable only during anticyclones in summer, rather than in winter – a formula associated with barometric pressure and sunny weather is likely to apply in summer (Goldstein, 1972; Parrot & Sabini, 1990), in winter however, severe frosts come into play and Cunningham, 1979, assumes that higher temperatures are more favorable.
A bad effect of high pressure can be confirmed in winter (during cyclones and anticyclones both) with WI-, during summer cyclones with DTR-, selected anticyclones (e+TN-DTR+SLP+C-S+HI-AO-) and selected cyclone (P+TX-). Good effect of high pressure is present especially for winter anticyclones (P-e-TN-TG-SLP+WI-HI-AO+), also during selected winter situations (DTR+NAO+), summer situations (W-), anticyclones (RH-) and cyclones (e+TG+).
A bad effect of high DTR was found for winter anticyclones with e+TX+TN+TG+DTR+DTR-C-WI+HI+ and for selected winter situations with NAO- and anticyclonic situations with P-. Mainly summer anticyclones (P-RH-e+TX+TN+TG+DTR+W-C-S+WI-HI+NAO-) dispose of favorable high DTR, as well as selected summer situations with AO+, winter situations with SLP+ and cyclonic situations with WI+.
3.7 Arctic Oscillation (AO) and North Atlantic Oscillation (NAO)
For AO, negative responses prevail within winter cyclones, for NAO within summer cyclones, for NAO positive responses within summer anticyclones (Fig. 5).
The effects of AO and NAO on the decision to go to vote affect the individual phases of oscillations – AO + and NAO + vs. AO- and NAO- (Hurrell, 1995; Budikova, 2009; Hurrell & Desser, 2009; Wanner et al., 2001 et al.). It has shown that a hollow stormtrack during AO- and NAO- producing cyclonic weather in mid-latitudes has positive effects on the comfort of voters who have a higher tendency to decide to go to elect. While winter cyclonic situations mitigate the effect of cold weather during the destabilization of the polar vortex (Petouhkov and Semenov, 2010, Francis and Vavrus, 2012, Walsh, 2014), cyclonic situations in summer alleviate high temperatures and most other meteorological elements which are connected with winter and summer extremes. The same effect applies to summer anticyclonic NAO situations, where colder and more stable air flows over Central Europe in front of a massive anticyclone over the British Isles (Boé et al., 2008; Blade et al., 2012).
A favorable effect of a lower AO index was detected especially for winter cyclones (P+e+TX+TG+SLP-C+WI-) and selected winter situations (RH-TN-DTR-W+S-NAO+), also in summer cyclones with e+W- and in summer near HI+, adverse effect of lower AO index for selected summer situations with S+ and anticyclonic situations with RH+.
We found a favorable effect of lower NAO index especially for summer cyclones with P+RH+e+TN+W-HI+, winter cyclones with e+HI+, selected cyclones with TX+TG+DTR-SLP-C+S-WI-, but also summer anticyclones with W-, selected summer situations with NAO-AO-, selected anticyclonal situations with S+ and selected winter situations with NAO +. adverse effect of lower NAO index was confirmed for winter anticyclones (P-RH+TG-SLP+SLP-S-HI-) and selected winter situations (TN-C-WI-).
3.8 Snow cover (SC)
During winter cyclonic situations, the occurrence of snow cover is positive (S-WI+AO-), as well as during selected winter situations (TX-NAO+) (Fig. 6).
4 Summarizing Discussion
In this chapter we evaluate the results in relation to possible regional differences (Chapter 4.1), according to anti- / cyclonality and season (chapter 4.2), above- and below-average values of elements (chapter 4.3), we deal with the limitations of the study (chapter 4.4) and finally we evaluate the most endangered categories of elections under the effects of the weather (chapter 4.5).
4.1 Regional differences and the expected effect of the local climate
Due to differences in climate in Slovakia (Fig. and Table 1, Bochníček et al., 2015; Lapin et al., 2002, Šoltís, 1990), it can be argued that:
– Data from weather stations with higher rainfall have a greater weight on the responses on voter turnout (e. g. Oravská Lesná, Telgárt) than those from stations on drier lowlands (e.g. Zeleňáková & Negm, 2018; Halmová et al., 2015; Pishvaei, 2002 ). Representation of summer showers and storms is most pronounced in mountainous areas, particularly in central Slovakia.Therefore also the response to precipitation and temperature during anticyclones in summer (S / Sp) at these stations will be higher.
– The effect of high temperatures is more pronounced in warmer, low-lying areas, mainly during days with higher humidity in summer, especially in situations with a Tn + (Výberči et al., 2015). In mountainous areas heavy frost has a stronger impact, in Carpathian frost valleys and basins in winter thanks to the barrier effect and more frequent inversions than in the lowlands (Matejovič, 2011).
– H, e and HI may be regionally diverse depending on whether the region is windward or leeward, forested or non-forested (e.g. Sanderson et al., 2012).
– While the lowlands and windwards are windier, closed barrier basins score in the categories of no wind and light wind (Polčák & Šťastný, 2010).
– Winds, mountain areas, north of the territory and in winter barrier basins (fog) are more cloudy, while lowlands, southern Slovakia and low-lying ventilated basins, in winter, on the contrary, high basins, more sunny.
– In the basins, the effects of high air pressure on the diurnal temperature range are more pronounced (e.g. Matejovič, 2011), while in the lowlands DTR tends to be smaller and low pressure brings more rain than snow in winter (eg Faško et al., 2009; Zeleňáková & Negm, 2018).
– Snow has a potentially greater impact on voting behavior in higher basins, windwards and mountain areas (Faško et al., 2009; Pecho et al., 2008).
Manifestations also differ between the positive and negative phases of AO and NAO – especially between the north and south of Slovakia (Kučera & Pecho, 2014; Blade et al., 2012 and Boé et al., 2008).
4.2Anti- / cyclonicity and season
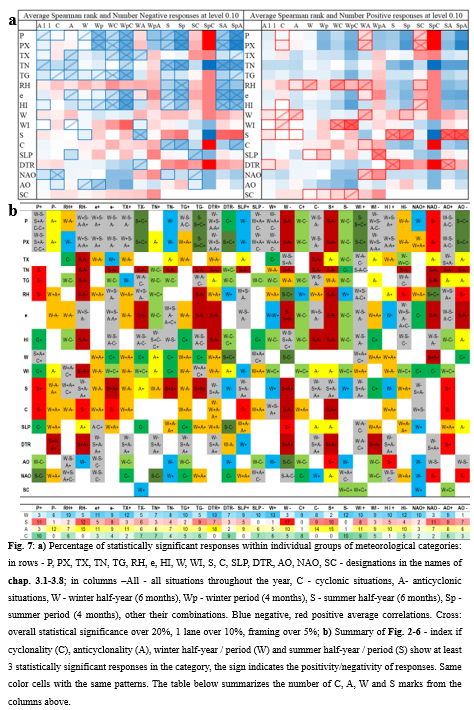
Some studies deal with overall statistical significance (Wilks, 2005; Wilks 1997; Livezey & Chen, 1983; Zwiers,1987; Chen, 1983; Livezey, 1985; Livezey, 1995; Preisendorfer & Barnett, 1983; Wigley & Santer, 1990). It is a question of what proportion of correlation tests should be statistically significant in order to achieve the so-called global / field statistical significance. The procedures used often vary. We decided to make a basic summary using exceeding the threshold percentages of statistically significant tests out of their total number.
Fig. 7a contains exceeded thresholds of percentages of statistically significant responses of 17 elements within individual groups of meteorological categories according to combinations of cyclonicity and season – left negative and right positive from the whole sample.
Most unavailable data fell under categories of the summer period (Sp, SpA, SpC) – due to less frequent elections, but also due to the fact that all years after 1989 were in Slovakia with a positive temperature deviation from DP 1901-2000 (Siman et al., 2014; Krška & Racko, 2020a, b), which excluded all cold categories.
For winter cyclones, the highest overall statistical significance was confirmed for negative responses for precipitation, temperatures, e and HI and positive responses for RH, WI and SC. These are colder, less suffocating cyclones with less precipitation, higher snow cover and higher windchill. During winter cyclones, the opposite effect of unfavorable humidex and more favorable windchill seems to be present (chapters 3.3 and 3.4, in accordance with Gaffen & Ross (1999) and Bos et al. (2012)), precipitation are also decisive (chapters 3.1, in accordance with Gomez et al., 2007; Persson et al., 2014; Artes, 2014; Arnold & Freier, 2016; Stockemer & Wigginton, 2018), which is due to lower temperatures (chapter 3.2, in difference with Van Assch et al. al. 2017; Stockemer & Wigginton, 2018; Eisinga et al., 2012) and higher snow cover (chapter 3.8).
Winter anticyclones have negative responses for TX, WI, S and DTR and positive responses for precipitation, RH, W, C, SLP and NAO. These are foggy days with less sunlight, less DTR and NAO +: situations with relatively warm winter anticyclones in the south from stormtrack (chapter 3.7, Wanner et al., 2001; Hurrell & Desser, 2009; Blade et al., 2012), with numerous inversions (therefore lower DTR, less C and positive effect W; chapters 3.6, 3.5, 3.4, Polčák & Šťastný, 2011; Bos et al., 2012; Parrot & Sabini, 1990). Thanks to “avoidant” responses to severe frosts and AO- / NAO-, one can partially agree with Gomez et al., 2007; Persson et al., 2014; Arts, 2014; Arnold & Freier, 2016; Stockemer & Wigginton, 2018, that very low temperatures during winter anticyclones are rather unfavorable.
Summer cyclones show the highest overall statistical significance for negative responses of SLP, NAO and AO and positive responses of precipitation, RH and HI. These situations are common for relatively deep low pressure during NAO- / AO- (chapter 3.7 – Boé et al., 2008; Wanner et al., 2001 et al.) with sufficient precipitation (chapter 3.1 – the most significant case where precipitation are positive, in contrast to Gomez et al., 2007; Persson et al., 2014; Artes, 2014; Arnold & Freier, 2016; Stockemer & Wigginton, 2018) and humidity (chapter 3.3 – humidity generally alleviates summer high temperatures in particular, as cyclonic weather provides predominantly summer cooling (in difference with Hassid et al., 2000; Santamouris et al., 2001; Gaffen & Ross, 1999). Another factor comes into play, namely the differences in leisure time spending across generations between summer and winter (the cross-section of leisure activities of four generations in Slovakia in the past and now is studied by Gabovičová & Neslušanová (2012 )), possibly between cyclonic and anticyclonic situations. The summer in Slovakia, especially during the anticyclonic situations, is typical with afternoon convective storms and torrential rain (Bochníček et al., 2015). Older generations often these days spend time in the garden, or it is used for household work or vacation. The use of free time by younger generations has changed with the development of new technologies. Cyclonic weather can thus temporarily interrupt these activities and contribute to higher turnout. Summer and winter time, particularly with the elderly half of the Slovak population, varies as the older generations are used to much more busier summers than winters (Gabovičová & Neslušanová, 2012, p. 16).
Summer anticyclones have negative responses of precipitation, temperature, RH, e, HI and C and positive responses of S and DTR. These are dry, sunny (chapter 3.5, Parrto & Sabini, 1990) and colder days (chapter 3.2, difference by Van Assche et al., 2017; Stockemer & Wigginton, 2018; Eisinga et al., 2012; Cunningham, 1979), with less precipitation (chapter 3.1, consistent with Gomez et al., 2007; Persson et al., 2014 ; Artes, 2014; Arnold & Freier, 2016; Stockemer & Wigginton, 2018) and humidity (chapter 3.3, storm situations tend to produce suffocating weather – Gaffen & Ross, 1999; Hassid et al., 2000; Santamouris et al., 2001) and higher daily temperature amplitudes (chapter 3.6, Goldstein, 1972).
4.3 Above-average and below-average values of elements and synergistic elements
In this chapter, we recapitulate in which categories with above-average and below-average values of
meteorological elements the statistical significance is achieved for a larger number of 17 meteorological elements (Fig. 7b).
For P-, statistical significance is achieved for several elements, especially during winter anticyclones, for P+ during summer cyclones. P+ responses are especially important, when the combination of several parameters during summer cyclones can significantly affect turnout (Gabovičová & Neslušanová, 2012; Boé et al., 2008; Francis et al., 2009).
For above-average temperatures, multi-element combinations predominate in winter (NAO +: Blade et al., 2012; Hurrell & Desser, 2009; Budikova, 2009), for below-average temperatures in summer (for cyclones near NAO-: Gabovičová & Neslušanová, 2012, Wanner et al., 2001 also in anticyclones with NAO +: Blade et al., 2012).
Above-average humidity can mobilize more elements in winter (especially during cyclones), below-average humidity during summer anticyclones (but with the opposite effect: Gaffen & Ross, 1999; Sanders & Brizollara, 1982). Water vapor pressure is active especially during anticyclone. Below-average humidex shows significant patterns in several elements throughout the year except for summer cyclones (Sanders & Brizollara, 1982), and above-average humidex during winter anticyclones (Bochníček et al., 2015).
Above-average wind and windchill can activate several elements especially in winter (temperature alleviation: Bochníček et al., 2015; Lapin et al., 2002), below-average especially in summer (both heatwaves and NAO+ anticyclones: Bochníček et al., 2015, Blade et al., 2012, Boé et al., 2008).
Above-average cloudiness and below-average sunshine are important (unfavorable) for several elements, especially during winter cyclones, while below-average clouds and above-average sunshine (favorable) during summer anticyclones (Parrot and Sabini, 1990).
Low pressure and low daily temperature amplitude are associated with the significance of several meteorological elements during winter cyclones (as an unfavorable factor), while high pressure and high daily amplitude during both winter and summer anticyclones (as a favorable factor) (Parrot & Sabini, 1990; Sanders & Brizollara, 1982).
AO + achieves relatively strong combinations throughout the year (brings mainly anticyclones: Hurrell, 1995; Wanner et al., 2001), while NAO- / AO- are limited mainly to summer anticyclones (higher risk of heatwaves – pressure lows with southern trajectory; Francis and Vavrus, 2012; Rahmstdorf et al., 2015).
4.4 Limitations of the study
Selection of study area. The results of this study reveal possible mechanisms of how the weather affects voter turnout in Slovakia. We expect the results to be similar in the mid-latitude countries, especially in the area of the transition between the oceanic and continental climate. Tropical and equatorial areas have not yet been explored at all, with areas of interest still moving between subtropical areas (Artes, 2014) and northern latitudes (Sweden, Canada; Stockemer & Wigginton; Persson et al., 2014).
Averaged values for the whole territory and possible regional differences. The criteria in this article are adapted to the whole-territory average of 17 meteorological elements which is why we consider it necessary to take into account regional distortions (chapter 4.1). The representativeness of the selected stations for this type of analysis should be verified by comparing the number of stations to the area and types of georelief (Fig. and Table 1). In some regions, such as northwestern Slovakia, the choice of stations was limited by data availability.
Selection of criteria for several meteorological elements. As we state in chapter 2.1.2, some values of meteorological elements entered the correlation analyzes directly, some were calculated using simple common formulas (Negretti & Zambra, 1879; Siple & Passel, 1945; Masterson & Richardson, 1979). Equations were selected to take into account the obtained data and at the same time to reflect with sufficient accuracy the real state of the meteorological elements.
Subjective nature of circulation types and Climatological relevance of CTs. Subjective determination of CTs on the basis of the “hand-made” principle may be in the case of anti- / cyclonality determination only slightly distorting (Fig. and Table 2, Table 1). Such distortion does not have to be present just during ambiguous CTS throughout the year, but also within the scope of changes related to regular historic records, which have a tendency to become more detailed. Some authors also use the so-called automatic classification, but this is not necessary for the purpose of the study (e.g. Philipp et al., 2010; Philipp et al., 2016; Cahynova and Huth, 2016; Huth, 2010; Chen, 2010; Linderson, 2001).
Placing election categories on one level, creation of the turnout index (IF). For the realization of the research, we place the turnout of different electoral categories on one level using the turnout index (IF) (Chapter 2.2.2). Relatively low number of election days in the same electoral categories may seem problematic, which had an impact on the resulting IF-s, and some inaccuracies may have arisen from this situation. However, the IF was designed to minimize these inaccuracies to the lowest possible level.
Observance of free democratic elections in Slovakia only since 1994. If we made the analysis for other Western countries, we could afford to use election data before 1990, which would contribute to greater availability of data for meteorological categories entering into correlation analyzes. The impact of declining turnout in established democracies (Eijk et al., 2011) on such results is questionable. In Slovakia, free democratic elections are held only after the establishment of an independent Slovak Republic, i.e. after 1.1.1993. Nevertheless, electoral history has produced enough election days to uncover most of the mechanisms in place.
Disjunction of shorter and longer winter / summer period. Due to the scope of the research (possible more than 100 thousand meteorological categories, most of which were calculated due to sufficient data – we offer in chapters 3.1-3.8 simplified ascents that put a predetermined wider and narrower winter / summer period on the same level. It is true that the results show a higher statistical significance during the narrower period.
Absence of elections during peaks of summer and winter seasons. Despite the higher statistical significance of meteorological categories falling under the narrower winter / summer period, election days in the period around the peak of winter / summer are absent. Such election days would probably improve the responses even more.
Relationship of results to changes in circulation. For a better overview of examination 17 meteorological elements it is a good idea to get acquainted with the overall trends and development of climatic elements in the wider region of Central Europe (eg Collins et al., 2013, Klein Tank & Können, 2003). Changing trends can then be more easily linked to climatic factors as NAO phases, the changing Arctic, increase in atmospheric blocking, changes to stormtrack position, shifting of individual singularities to an earlier period / later period etc.
4.5 Possible most vulnerable categories in elections under adverse weather conditions
If we consider the categories of elections that may be most affected by meteorological elements, the general worst conditions for the final decision of (potential) voters can be clearly identified (Knack, 1994; Bassi, 2013). As can be seen from Fig. 7a, during a shorter winter / summer period lasting only 4 months as opposed to the winter / summer half-year, the results are more robust. Therefore, it can be considered that the most endangered categories will be those that take place closest to the peak of the winter / summer season. These are mainly the winter categories Communal Elections and Elections to Higher Territorial Units (VÚC), held in December or in late autumn. Considered the most endangered category in the summer, in particular, the European Parliament elections, held in May or June, which are indeed regularly marked by low participation in Slovakia, also due to other factors (Clark, 2014; Karvai & Plenta, 2010).
Conclusions
Main findings. This paper presents an overview of our findings and statistically significant responses of 17 meteorological elements on elections in Slovakia during the period 1994-2019. Different categories of elections were placed on one level by Final index of voter turnout (IF). IF was then subjected to a correlation analysis with averaged daily values of 17 meteorological elements.
In most studies investigating the relationship of precipitation and temperature with turnout, only simple framework investigating were used that did not consider the season, cyclonality, and- / below-average values of elements and their combinations. Therefore, our detailed results can be compared only to a certain degree with features of behavioral responses identified in other studies.
For precipitation throughout the year, their negative impact on turnout significantly prevails. The results are consistent with findings from other countries – Gomez et al., 2007; Persson et al., 2014; Arts, 2014; Arnold & Freier, 2016; Stockemer & Wigginton, 2018.
Negative responses also predominate in temperatures – for TX winter anticyclonic, for TN summer anticyclonic and for TG winter anticyclonic and cyclonic, but this does not correspond to the findings of other authors, however, from other countries, with partially different climate (Van Assche et al. 2017; Stockemer & Wigginton, 2018; Eisinga et al., 2012).
There is a negative effect of high humidity during summer anticyclones and a favorable effect especially during winter anticyclones and cyclones. There are also neagtive effects of high water vapor pressure throughout the year, more for anticyclones and favorable during some winter situations and negative effects of high humidex during especially summer anticyclonic and winter cyclonic situations and favorale effects during some cyclonic situations, especially in summer. Sanders & Brizzolara, 1982’s claim that a good mood (and thus, according to Bassi, 2013, also a willingness to go to the polls) is associated with lower humidity, confirms that the findings only partially – for summer (stormy) anticyclones. However, the negative effect of high humidex has been confirmed (i.e., suffocation; Gaffen and Ross, 1999; Steadman, 1994 et al.).
The positive responses of average wind speed are significantly predominant, especially for winter anticyclonic, less winter cyclonic and summer anti- / cyclonic situations. The wind lowering the sensory temperature is favorable especially for winter anticyclones and unfavorable for winter cyclones. The impact of stronger winds is not only beneficial on mental health (Bos et al., 2012), but also on voter turnout.
A negative effect of sunlight and favorable effect of cloudiness during winter anticyclones and vice versa, a favorable effect of sunshine and a negative effect of cloudiness during summer anticyclones a (less summer cyclones) were confirmed. The beneficial effect of sunlight (Parrot & Sabini, 1990) was thus confirmed only predominately, especially during the summer anticyclones.
Positive responses for winter anticyclones and SLP, as well as for summer anticyclones, and DTR and negative responses for winter anticyclones, predominate. Fewer winter anticyclonic and winter cyclonic negative responses were found for SLP. Most of SLP responses are positive, so we can rather confirm the claims of Goldstein, 1972, who argued that good mood is associated with high barometric pressure. This is not entirely true for DTR, where a larger DTR is favorable only during anticyclones in summer, but not in winter.
Negative responses predominate for winter cyclones with AO, for summer cyclones with NAO, positive responses for summer anticyclones with NAO. It has been shown that a stormtrack during AO- and NAO- producing cyclonic weather in mid-latitudes has positive effects on the comfort of voters who have a higher tendency to choose to go to the polls.
The positive impact of the snow cover was also confirmed.
The results may vary from region to region (Chapter 4.1): they were examined in Summary Statistical Significance and the synergic effects of the elements within the individual basic categories.
Possibilities of using the approach in practice. Established democracies have faced the problem of declining turnout in recent decades (Eijk et al., 2011). The interest of voters is often abused by populist and extremist movements (Fig. 1b) and only after their onset is the political struggle revived.
The results of this article offer an alternative to a potential increase in turnout, even at the cost of higher potential voter turnout (Knack, 1994, Bassi, 2013). An example is the elections to the European Parliament, which take place at the turn of spring and summer, which are indeed facing very low turnout, and the European Union is making great efforts to raise the turnout. This could probably be achieved by changing the election date to an earlier spring period, or to prefer an earlier date, partially.
On the other hand, we wish to contribute to the general awareness of the public and politicians that adverse / unfavorable weather can often decide the outcome of elections. Therefore, the weather factor should be included among the important factors that may affect not only the turnout, but also the whole subsequent election period.
References
Agaibe F. (2015). Voter Apathy and Voter Turnout in the 2015 General, The Electoral Institute, INEC, Abuja.
Aldrich J. H. (1993). Rational Choice and Turnout. John H. Aldrich. American Journal of Political Science, Vol. 37, No. 1. (Feb., 1993), pp. 246-278.
Alexander L., Zhang X., Peterson T., Caesar J., Gleason B., Klein Tank A., Haylock M., Collins D., Trewin B., Rahimzadeh F., Tagipour A., Ambenje P., Rupa Kumar K., Revadekar J, Griffiths G. (2006). Global observed changes in daily climate extremes of temperature and precipitation. Journal of Geophysical Research111: D05,109. DOI: 10.1029/2005JD006290.
Ansolabehere S., Persily N., Stewart Ch. (2012). Regional Differences in Racial Polarization in the 2012 Presidential Election: Implications for the Constitutionality of Section 5 of the Voting Rights Act, 126 Harv. L. Rev. Forum 205, 209.
Arnold L. (2001). Hasselmann’s program revisited: The analysis of stochasticity in deterministic climate models. In P. Imkeller and J.-S. von Storch, editors, Stochastic Climate Models, volume 49 of Progress in Probability, pages 141–158, Boston, 2001. Birkhäuser.
Arnold F., Freier R. (2016). Only conservatives are voting in the rain: Evidence from Germanlocal and state elections. Electoral Studies 41, 216–221.
Artes, J. (2014). The rain in Spain: Turnout and partisan voting in Spanish elections, European Journal of Political Economy 24 126-141.
Ayres S. (2009). European Parliament Elections: Turnout trends, 1979-2009. House of Commons Library, London, United Kingdom. 1-22.
Bassi A. (2013). Weather, Mood, and Voting: An Experimental Analysis of the Effect of Weather Beyond Turnout A Bassi Available at SSRN 2273189.
Bernhagen P., Marsh M. (2006). Voting and Protesting: Explaining Citizen Participation in Old and New European Democracies. Democratization, Volume 14, Issue 1, 2007. 1-4.
Bevelander P. (2010). Voting Participation of Natives and Immigrants in Sweden – a Cohort Analysis of the 2002, 2006 and 2010 Elections; Malmö Institute for Studies of Migration, Diversity and Welfare, Malmö University 2010.
Björkstén, K., Kripke, D., Bjerregaard, P., 2009. Accentuation of suicides but not homicides with risinglatitudes of Greenland in the sunny months. BMC Psychiatry 2009, 9, doi:10.1186/1471-244X-9-20.
Blade I. , Liebmann B. , Fortuny D. (2012). Observed and simulated impacts of the summer NAO in Europe: implications forprojected drying in the Mediterranean region, DOI: 10.1007/s00382-011-1195-x
Blais, A. (2000). To Vote or Not to Vote? The Merits and Limits Rational Choice Theory. University of Pittsburgh Press, Pittsburgh.
Blais A., Massicotte L., Dobrzynska A. (2003). Why is Turnout Higher in Some Countries than in Others? Ottawa Elections Canada. 1-28
Blais A., Kess J. R. (2006). Electoral Systems and Turnout; Acta Politica (2006)41,180–196.Bryan et al. (2011). Motivating voter turnout by invoking the self; PNAS, August 2, 2011, vol. 108, no. 31.
Bochníček O. and Co-authors (2015). Klimatický atlas Slovenska [Climate Atlas of Slovakia]. Atlas je dostupný aj na CD a online z http://klimat.shmu.sk/kas/, 132 s.
Boé J., Terray L., Cassou C., Najac J. (2008). Uncertainties in European summer precipitation changes: role of large scale circulation Clim.Dyn., doi10.1007/s00382- 008-0474-7.
Borghesi C., Raynal J. C., Bouchaud J. P. (2012). Election Turnout Statistics in Many Countries: Similarities, Differences, and a Diffusive Field Model for Decision-Making. PLoS ONE 7(5).
Bos, E. H., Hoenders, R., de Jonge, P. (2012). Wind direction and mental health: a time-series analysis of weather influences in a patient with anxiety disorder. BMJ case reports, 2012, bcr2012006300. https://doi.org/10.1136/bcr-2012-006300
Brádka J., Dřevikovský, A., Gregor, Z., Kolesár J. (1961). Počasí na území Čech a Moravy v typických povětrnostních situacích. Praha, HMÚ 1961.Brians C., Grofman B., Grofman B. (2001). ‘Election day registration’s effect on US voter turnout.’ Social Science Quarterly. 82(1): 170-183.
Brians, Craig Leonard, and Bernard Grofman. 2001. ElectionDay Registration’s Effect on U.S. Voter Turnout. Social Science Quarterly 82( 1): 170-83.
Bryan, C. J., Walton, G. M., Rogers, T., & Dweck, C. S. (2011). Motivating voter turnout by invoking the self. Proceedingsof the National Academy of Sciences, USA, 108, 12653–12656. Casanova J. (2005). “Catholic and Muslim Politics in Comparative Perspective,” Örtünme (İstanbul: Kitap Yayınevi: 2005), 162-88.
Budikova, D. (2009). Role of Arctic Sea ice in global atmospheric circulation: A review. Global Planet. Change, 68(3).
Cahynová M., Huth R. (2016). Atmospheric circulation influence on climatic trends in Europe: an analysis of circulation type classifications from the COST733 catalogue, International Journal of Climatology, 36, 7, pp. 2743–2760.
Cameron, S. (2005). Making Regression Analysis More Useful, II. Econometrics. Maidenhead: McGraw Hill Higher Education. pp. 171–198. ISBN 0077104285.
Canova F. (1998). Detrending and Business Cycle Facts. Journal of Monetary Economics, 41, 475-512.
Chen D. (2000). A monthly circulation climatology for Sweden and its application to a winter temperature case study. Int. J. Climatol. 20: 1067-1076.
Clark N. (2014). Explaining low turnout in European elections: The role of issue salience and institutional perceptions in elections to the European Parliament’, Journal of European Integration 36(4): 339-356.
Cogley T., Nason J. M. (1995b). Effects of the hodrick-prescott filter on trend and difference stationary time series: Implications for business cycle research, Journal of Economic Dynamics and Control 19, 253—278.
Collins M., Knutti R., Arblaster J., Dufresne J.-L., Fichefet T., Friedlingstein P., Gao X., Gutowski W. J., Johns T., Krinner G., Shongwe M., Tebaldi C., Weaver A. J., a Wehner M., 2013. Long-term climate change: Projections, commitments and irreversibility. In Climate Change 2013: The Physical Science Basis. Contribution of Working Group I to the Fifth Assessment Report of the Intergovernmental Panel on Climate Change. T.F. Stocker, D. Qin, G.-K. Plattner, M. Tignor, S.K. Allen, J. Doschung, A. Nauels, Y. Xia, V. Bex, and P.M. Midgley, Eds. Cambridge University Press, 1029-1136, doi:10.1017/CBO9781107415324.024.
Conover W.J. (1999). Practical Non-parametric Statistics (3rd edition). ISBN 0-471-16068-7 1999; 314.
CPC NOAA, 2019. Mesačné a ročné indexy blokujúcich módov NAO, AO, EA, EU2, EU1 (Northern Hemisphere Teleconnection Patterns)
<http://www.cpc.ncep.noaa.gov/data/teledoc/telecontents.shtml>.
Cunnigham M. R. (1979). Weather, Mood, and Helping Behavior: Quasi-experiments with Sunshine Samaritan, Journal of Personality and Social Psychology, 37, 1947—1956.
Chavarria H., 2014. Economic Inequality and Voter Turnout in High-Income Democracies; Budapest, Hungary 2014.
ECA&D, 2018. Indices of extremes. Indices dictionary <http://eca.knmi.nl/indicesextremes/indicesdictionary.php> [12.11.2019] Enviroment and natural resources, 2016.
Edlin A. et al. (2007). Voting as a Rational Choice: Why and How People Vote to Improve the Well-Being of Others; Rationality and Society Copyright © 2007 Sage Publications. Vol. 19(3): 293–314.
Eijk, C., Schmitt, H., Sapir, E. (2011) : The Electoral Consequences of Low Turnout in the European Parliament Elections of 2009.
Eisinga R., Grotenhuis M.T., Pelzer B. (2012). Weather conditions and voter turnout in Dutch national parliament elections, 1971–2010
International Journal of Biometeorology, 56 (4) (2012), pp. 783-786.
Faško, P., Lapin, M., Pecho, J., Mikulová, K. (2009). Analysis of snow cover characteristics change in Slovakia.In: Proceedings from 30th InternationalConference on Alpine Meteorology: Programme & ExtendedAbstracts, Germany, Rastatt, 11.-15. May 2009, Deutscher Wetterdienst, Offenbach am Main, Germany; pp. 170-171, ISBN 978-3-88148-440-4.
Feddersen T. J. et al. (2004). Rational Choice Theory and the Paradox of Not Voting; Journal of Economic Perspectives—Volume 18, Number 1—Winter 2004 —Pages 99 –112.
Fraga, B. and E. Hersh. (2010). Voting Costs and Voter Turnout in Competitive Elections. Quarterly Journal of Political Science 5(4): 339-356.
Francis J. A., Chan W., Leathers D.J., Miller J.R. & Veron D.E. 2009. Winter Northern Hemisphere weather patterns remember summer Arctic sea ice extent. Geophysical Research Letters 36, L07503, doi: 10.1029/2009GL037274.
Francis, J. A., Vavrus, S. J., 2012. Evidence linking Arctic amplification to extreme weather in mid-latitudes, Geophys. Res. Lett., 39, L06801, doi:10.1029/2012GL051000.
Froese P. (2014). Religion and American Politics from a Global Perspective; Religions 2014, 5, 648–662.
Fujiwara T., Meng K., Vogl T., (2016). Habit formation in voting: Evidence from rainy elections. American Economic Journal: Applied Economics 8 (4), 160-88, 2016.
Gabovičová N., Neslušanová S. (2012). Kvalitatívna analýza voľného času príslušníkov štyroch generácií. Zborník Pedagogickej fakulty Trnavskej univerzity. Séria D – Vedy o východe a vzdelávaní, ročník 16, Trnavská univerzita.
Gaffen D.J., Ross R.J. (1999). Climatology and trends in U.S. surface humidity and temperature. Journal of Climate 1999, 12, 811–828.
GAO (2012). Elections: Views on Implementing Federal Elections on a Weekend, Such ID requirements have been cited as an attempt to help ensure the integrity of the voting process on Election Day at the polls in the event that ineligible voters may attempt to vote. Fourteen states and the District of Columbia do not have. GAO-12-69 (Washington, D.C.: Jan. 12, 2012).
Gatrell J. D., Bierly G.D. (2002) Weather and voter turnout. Kentucky primary and general elections, 1990–2000. Southeast Geogr 42:114–134.
Gerber A. S., Rogers T. (2009). Descriptive Social Norms and Motivation to Vote: Everybody’s Voting and so Should You. The Journal of Politics, Vol. 71, No. 1, January 2009, Pp. 178–191.
Giese H.J., Albeverio S, Stabile G. (1999). Stochastic and deterministic methods in the analysis of the delta O-18 record in the core V28-239 CHEMICAL GEOLOGY, H.J. Giese and others, “Stochastic and deterministic methods in the analysis of the delta O-18 record in the core V28-239”, CHEM GEOL, 161(1-3), 1999, pp. 271-289.
Goldstein K. M. (1972). “Weather, Mood, and Internal-External Control,” Perceptual Motor Skills, 35, 786.
Gomez B. T., Handsford T., Krause G. (2007). The republicans should pray for rain: weather, turnout, and voting in U.S. Presidential elections. The Journal of Politics 69 (3), 649–663.
Hagan A. S. (2009). “Race and city-county consolidation: black voting participation and municipal elections.”. Electronic Theses and Dissertations. Paper 559.
Halmová D., Pekárová P., Olbřímek J., Miklánek P., Pekár J. (2015). Precipitation Regime and Temporal Changes in the Central Danubian Lowland Region. Advances in Meteorology, 2015.
Hamilton, J.D. (1994). Time Series Analysis. Chapter Princeton: Princeton University Press.
Hansford T.G., Gomez B.T. (2010) Estimating the electoral effects of voter turnout. Am J Polit Sci 104:268–288.
Hassid S., Santamouris M., Papanikolaou M., Linardi A., Klitsikas N., Georgakis C., Assimakopoulos D.N. (2000). The effect of the Athens heat island on air conditioning load. Energy and Buildings, 32: 131-141.
Healy A., Malhotra N. (2010). Random Events, Economic Losses, and Restrospective Voting: Implications for Democratic Competence. Quarterly.
Horiuchi, Y., Kang, W.. CH. (2015). Electoral Consequences of Rainfall on the Election Day: Compositional Data Analysis (January 19, 2015). Available at SSRN: <http://ssrn.com/abstract=2551928 orhttp://dx.doi.org/10.2139/ssrn.2551928>. Praeger. Green, John C., and Paul S. Herrnson, eds. 2002.
Horiuchi, Y.; Kang, W. Ch. (2017). Why Should the Republicans Pray for Rain? Electoral Consequences of Rainfall Revisited. American Politics Research. doi:10.1177/1532673×17745631.
Howe P. (2006). Political Knowledge and Electoral Participation in the Netherlands: Comparisons with the Canadian Case. International Political Science Review Vol. 27, No. 2: 137-166.
Hurrell J.W. (1995). Decadal trends in the North Atlantic oscillation: Regional temperatures and precipitation, Science 269, 676–679.
Hurrell J.W., Desser C. (2009). North Atlantic climate variability: The role of the North Atlantic Oscillation, DOI: 10.1016/j.marsys.2008.11.026.
Huth R. (2010). Synoptic-climatological applicability of circulation classifications from the COST 733 collection: first results. Physics and Chemistry of the Earth 35, 388–394.Huth R., Beck C., Philipp A., Demuzere M., Ustrnul Z., Cahynová M., Kyselý J., Tveito O.E., 2008. Classifications of atmospheric circulation patterns: recent advances and applications. In: Trends and Directions in Climate Research. Ann. N. York Acad. Sci., 1146, 105-152.
Johnson, R. J. (1991): A question of place: Exploring the practice of human geography. Oxford (Blacwell Publishing).
Jones M. (2004). Gender and political participation. The Electoral Commission 2004 ISBN: 1-904363-41-5.
Karl T.R., Nicholls N., Ghazi A. (1999). CLIVAR/GCOS/WMO workshop on indices and indicators for climate extremes:
Workshop summary. Climatic Change, 42, 3-7.
Karvai A., Plenta P. (2010). Volebné správanie vo voľbách do Európskeho parlamentu. Platí koncept druhoradých volieb v nových členských štátoch EÚ? s. 131. In: European electoral Studies, Vol. 5 (2010), No1.
Kavanagh A. P. (2006). A Geographically Weighted Regression Analysis of General Election Turnout in the Republic of Ireland; Political Studies Association of Ireland Conference, University College Cork, 20 October 2006.
Keller M. C. et al. (2005). “A Warm Heart and a Clear Head. The Contingent Effects of Weather on Mood and Cognition,” Psychological Science, 16(9), 724—731.
Klein Tank A., Können G., 2003. Trends in indices of daily temperature and precipitation extremes in Europe, 1946–99. Journal of Climate 16: 3665–3680.
Krška K., Racko S. (2020a). Horúce leto 1992 v Českej a Slovenskej republike, jeho synoptický prehľad a klimatologické zhodnotenie (Hot summer in 1992 in the Czech and Slovak Republics and its synoptic interpretation and climatological evaluation). In: metmladez.cz, dostupné na internete: http://metmladez.wz.cz/racko/prace/leto92/leto92.html
Krška K., Racko S. (2020b). Mimoriadne teplé leto 1994 v Českej a Slovenskej republike (Extraordinary hot summer in 1994 in the Czech Republic and the Slovak Republic). In: metmladez.cz, dostupné na internete: http://metmladez.wz.cz/racko/prace/leto94/leto94.html
Kučera M., Pecho J., (2014). Priestorová a časová variabilita extrémov teploty vzduchu na Slovensku a ich vzťah k cirkulačným podmienkam v priestore strednej Európy. Geografická revue, Katedra geografie, geológie a krajinnej ekológie, ISSN: 1336-7072, 26 s.
Lapin M., Faško P., Melo M., Šťastný P., Tomlain J. (2002). Climatic regions. In: Landscape atlas of the Slovak Republic. Ministry of Environment of the Slovak Republic, Slovak Environmental Agency, Bratislava-Banská Bystrica <avaliable via Internet: http://globus.sazp.sk/atlassr/>.
Lasala-Blanco N., Shapiro R., Rivera-Burgos V (2017). “Turnout and weather disruptions: Survey evidence from the 2012 presidential elections in the aftermath of Hurricane Sandy”. Electoral Studies, Volume 45, Pages 141-152. February 2017.
Lauritsen R. G., J. C. Rogers (2012). U.S. diurnal temperature range variability and regional causal mechanisms, 1901–2002. J. Climate, 25, 7216–7231, doi:10.1175/JCLI-D-11-00429.1.
Linderson M.-L. 2001. Objective classifi cation of atmospheric circulation over southern Scandinavia. Int. J. Climatol. 21: 155-169.
Liu J., Curry J. A., Wang H., Song M. a Horton R. M., 2012. Impact of declining Arctic Sea ice on winter snowfall Proc. Natl Acad. Sci. USA
109 4074–9.
Livezey, R.E., and W.Y. Chen, 1983. Statistical field significance and its determination by Monte Carlo techniques. Monthly Weather Review, 111, 46–59.
Livezey, R.E., 1985. Statistical analysis of general circulation model climate simulation: sensitivity and prediction experiments. Journal of the Atmospheric Sciences, 42, 1139–1149.
Livezey, R.E., J.D. Hoopingarner, and J. Huang (1995). Verification of official monthly mean 700-hPa height forecasts: an update. Weather and Forecasting, 10, 512–527.
Ludlum, David M. (1984). “The Weather Factor”. Boston: American Meteorological Society.
Madestam A., ShoagD., VeugerS., & Yanagizawa-DrottD. (2013). Do Political Protests Matter? Evidence from the Tea Party Movement?. The Quarterly Journal of Economics, 128(4), 1633-1685.
Madleňák, T. (2010). Hlavné trendy výskumu v súčasnej geografii. Geografický časopis / Geographical Journal 62 (2010) 2, 127-145.
Masterton J. M., Richardson F. A. (1979). Humidex; a method of quantifying human discomfort due to excessive heat and humidity. Downsview, Ont, Environment Canada, Atmospheric Environment.
Matejovič P. (2011). Zima A.D. 1500-2010: história a podoby zím v Európe a na Slovensku. – 1. vyd. – Bratislava: Veda, 2011. – res. il. – 281 s. ; 23 cm. – (Svet vedy ; zv. č. 20). – ISBN 978-80-224-1208-7.
McNabb D. E. (2010). Research Methods for Political Science: Quantitative and Qualitative Approaches (2nd ed.). New York, NY: M.E. Sharpe, Inc.
Ministry of Justice (2010). Election Day: Weekend Voting, March 2010, ISBN 9780101783521, Cm 7835.
Mudelsee M. (2010). Climate Time Series Analysis: Classical Statistical and Bootstrap Methods, Vol. 42 of Atmospheric and Oceanographic Sciences Library (Springer, 2010).
Negretti & Zambra (1879). Encyclopedic Illustrated and Descriptive Reference Catalogue of Optical, Mathematical, Philosophical, Photographic and Standard Meteorological Instruments, Manufactured and Sold by them, London c. 1879, title pages. Later patent 6276/15 1915, London.
Parrot, G. W., Sabini J.. (1990). “Mood and Memory under Natural Conditions: Evidence for Mood Incongruent Recall,” Journal of Personality and Social Psychology.
Pecho, J., Faško, P., Mikulová, K., Sadovský, Z., Bochníček, O., Kajaba, P., (2008): Snow water equivalentregime and processing of its maximum values in Slovakia as basic data source for snow load standardassessment. In: Abstracts of the Scientific Programme, Eighth Annual Meeting of the EuropeanMeteorological Society, Seventh European Conf, on Applied Climatology (ECAC), Amsterdam – TheNetherlands, 29 September – 3 October, Volume 5, 2008, ISSN 1812-7053 + CD.
PerssonM., A. Sundell, Ohrvall R. (2014). Does Election Day weatheraffect voter turnout? Evidence from Swedish elections,” Electoral Studies, 33, 335–342.
Peterson T.C. and co-authors: Report on the Activities of the Working Group on Climate Change Detection and Related Rapporteurs 1998-2001. WMO, Rep. WCDMP-47, WMO-TD 1071, Geneve, Switzerland, 143pp.
Petoukhov V., Semenov V., 2010. A link between reduced Barents-Kara Sea ice and cold winter extremes over northern continents. J. Geophys. Res.-Atmos,. 115 (2010).
Philipp A., Bartholy J., Beck Ch., Erpicum M., Esteban P., Fettweis X., Huth R., James F., Jourdain S., Kreienkamp F., Krennert T., Lykoudis S., Michalides S. C., Pianko-Kluczynska K., Post P., Álvarez D. R., Schiemann R., Spekat A., Tymvios F. S. (2010). Cost733cat-A database of weather and circulation type classifications, Physics and Chemistry of the Earth, 35, 9-12, pp. 360-373
Philipp A., Beck, Ch., Huth R., Jacobeit J. (2016). Development and comparison of circulation type classifications using the COST 733 dataset and software. International Journal of Climatology, 36, 7, pp. 2673-2691.
Pishvaei M R. (2002). Areal and temporal analysis of precipitation patterns in Slovakia using spectral analysis. In Proceedings of the EGS 27th General Assembly, Nice, France, 2002, abstract no. 6074.
Polčák N., Šťastný P., 2010: Vplyv reliéfu na veterné pomery Slovenskej republiky. FPV UMB B. Bystrica, SHMÚ Bratislava, 132 s., ISBN 978-80-8083-993-2.
Powell, G. B., (1986). American voter turnout in comparative perspective. American Political Science Review 80, 17–43.
Preisendorfer R.W., and Barnett T.P. (1983). Numerical-reality intercomparison tests using small-sample statistics. Journal of the Atmospheric Sciences, 40, 1884–1896.
Qu M., Wan J., Hao X, (2014). Analysis of diurnal air temperatur range change in the continental United States. Weather and Climate Extremes, 4, 86-95, 2014.
Rahmstrof, S., Box, J.E., Feulner, G., Mann, M.E., Robinson, A., Rutherford, S., Schaffernicht, E.J., 2015. Exceptional twentieth century slowdown in Atlantic Ocean Overturning circulation, Nature Clim. Change, publ. online 23 March doi:10.1038/NCLIMATE2554, 2015.
Sanders, J. L., Brizzolara M. S. (1982). “Reand Mood,” Journal of General Psychology, 107, 155—156.
Sanderson M., Pope E., Santini M. (2012). Influences of EU forests on weatherpatterns: Final report. European Commission (DG Environment) August 2012.
Santamouris M., Pavlou K., Synnefa A., Niachou K., Kolokotsa D. (2007). Recent progress on passive cooling techniques. Advanced technological developments to improve survivability levels in lowincome households. Energy and Buildings, 39: 859-866.
Seljan E. (2015). Understanding Political Science Statistics using Stata: A Manual with Exercises. Anotated, Routledge, 2017, ISBN 1351538039, 9781351538039, 184 p.
Shapiro, S. S.; Wilk, M. B. (1965). An analysis of variance test for normality (complete samples). Biometrika. 52 (3–4): 591–611. doi:10.1093/biomet/52.3-4.591. JSTOR 2333709. MR 205384. p. 5.
Sheskin D. J. (2003). Handbook of Parametric and Nonparametric Statistical Procedures (3rd edition). ISBN 1-58488-440-1 2003; 1016.
Siman C., Matejovič P., Libo M. (2014). Klimatologické zhodnotenie leta 2014, In: Fórum pre vedu a umenie, ISSN 1339-2492. [cit. 2017-07-30]. Avaliable via the Internet <http://www.nun.sk/leto_2014.htm>
Siple P.A., Passel C.F. (1945). Measurements of dry atmospheric cooling insubfreezing temperatures, Proc. Am. Phil. Soc. 89 , blz. 177-199.
Steadman, R. G. (1979). The assessment of sultriness. Part I: A temperature–humidity index based on human physiology and clothing science. J. Appl. Meteor.,18, 861–873.
Steadman R.G. (1994). Norms of apparent temperature in Australia. Australian Meteorological Magazine, 43: 1-16.
StockemerD., Wigginton M. J., 2018. Fair weather voters: do Canadians stay at home when the weather is bad? International Journal of Biometeorology 62 (2018): 1027-1037.
Šoltís J., (1990). Klimatické pomery Slovenska. Vybrané charakteristiky. Mapová časť. Vietor. Mapa 6.1.-6.7. Zborník prác SHMÚ, zv. č. 33/II. Bratislava, Alfa.
Van Assche J., Van Hiel A., Stadeus J., Bushman B. J., De Cremer D., Roets, A. (2017). When the Heat Is On: The Effect of Temperature on Voter Behavior in Presidential Elections. Frontiers in Psychology, retrieved from http://journal.frontiersin.org/article/10.3389/fpsyg.2017.00929/full.
Výberči D., Švec M., Faško P., Savinová H., Trizna M, Mičietová E., (2015). The effects of the 1996-2012 summer heat events on human mortality in Slovakia. Moravian Geographical Reports 23: 58-70. Feb 9, 2016In: Moravian Geographical Reports. – Vol. 23, No. 3 (2015), s. 58-70.
Walsh, J. E., 2014. Intensified warming of the Arctic: Causes and impacts on middle latitudes, Global and Planetary Change, Volume 117.
Wanner H., Bronninmann S., Casty C., Gyalistras D., Luterbacher J., Schmutz Ch., Stephenson D. B., Xoplaki E. (2001). North atlantic oscillation – Concepts and studies, Surveys in Geophysics 22: 321–382, 2001.
Watson M.W. (1986). Univariate Detrending Methods with Stochastic Trends. Journal of Monetary Economics 18, 49-75.
Wigley T.M.L, and Santer B.D. (1990). Statistical comparison of spatial fields in model validation, perturbation, and predictability experiments. Journal of Geophysical Research, D95, 851–865.
Wilks, D.S. (1997). Resampling hypothesis tests for autocorrelated fields. Journal of Climate, 10, 65–82.
Wilks D.S. (2005). Statistical Methods in the Atmospheric Sciences, Volume 100, 2nd Edition. Imprint: Academic PressPublished Date: 21st November 2005, 648 p., eBook ISBN: 9780080456225.
Wu Z., Huang N.E., Long S.R., Peng C.-K. (2007). On the trend, detrending, and variability of nonlinear and nonstationary time series. Proceedings of the
National Academy of Sciences 4 (38), 14889–14894.
Zeleňáková, M. and Negm, A. M. (2018). Update, Conclusions and Recommendations for Water Resources in Slovakia: Climate Change, Drought
and Floods. In Water Resources in Slovakia: Part II (pp. 325-338). Springer, Cham.
Zwiers, F.W., and H.J. Thiébaux (1987). Statistical considerations for climate experiments. Part I: scalar tests. Journal of Climate and Applied Meteorology, 26, 465–476.
Basemap sources
Atlas krajiny SR (2002). Priemerná ročná teplota vzduchu. Priemerné ročné úhrny zrážok. Priemerné ročné zrážky. Priemerná teplota v januári. Priemerné úhrny zrážok v januári. Priemerná teplota v júli. Priemerné úhrny zrážok v júli. In: Lapin M., Faško P., Melo M., Šťastný P., Tomlain J.: Atlas krajiny SR, IV. Prvotná krajinná štruktúra, IV.III. Ovzdušie – Subchapters 5, 7, 14, 15, 17, 18. Bratislava – Ministerstvo životného prostredia SR, Banská Bystrica – Slovenská agentúra životného prostredia, 344 s., ISBN 80-88833-27-2, dostupné na internete: [13.11.2019] http://geo.enviroportal.sk/atlassr/
Vidiani.com (2019). Relief map of Slovakia. Slovakia relief map. [13.11.2019] <http://www.vidiani.com/relief-map-of-slovakia/>