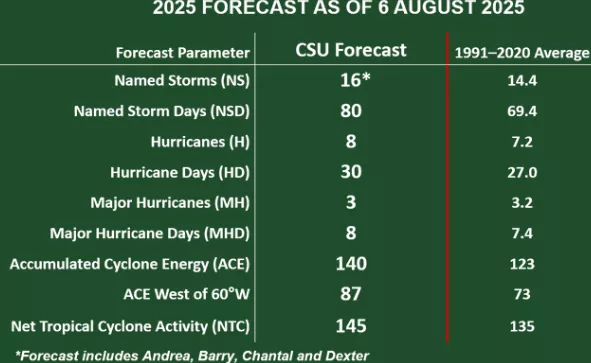
Colorado State University’s August update maintains that the 2025 Atlantic hurricane season will be slightly above normal, though note there’s lower-than-average confidence in the forecast.
Key Forecast Metrics (Remaining Season):
- Named Storms: 16 (1991–2020 avg.: 14.4)
- Named Storm Days: 80 (avg. 69.4)
- Hurricanes: 8 (avg. 7.2)
- Hurricane Days: 30 (avg. 27.0)
- Major Hurricanes (Cat 3+): 3 (avg. 3.2)
- Major Hurricane Days: 8 (avg. 7.4)
- Accumulated Cyclone Energy (ACE): 140 (avg. 123)
- ACE West of 60°W: 87 (avg. 73)
- Net Tropical Cyclone activity: 145% of average
Landfall Probabilities
Still trending above normal, the forecast includes the probability of a major hurricane (Category 3–5) creating landfall:
- Entire U.S. coastline: 48% (historical avg. 43%)
- U.S. East Coast (incl. Florida peninsula): 24% (avg. 21%)
- Gulf Coast (FL panhandle west to Brownsville): 31% (avg. 27%)
- Caribbean: 52% (avg. 47%)
Forecast Drivers & Uncertainty
- Warmer-than-normal sea surface temperatures across the eastern and central tropical Atlantic are fueling potential storm development.
- Expected ENSO-neutral conditions during the peak season further enhance the likelihood of storm formation.
- However, elevated wind shear in the Caribbean during June and July injects uncertainty into the forecast, limiting confidence despite favorable thermal conditions.
Bottom Line
- The CSU update continues to call for a season that’s slightly more active than the long-term norm, with higher-than-average risks for major hurricane landfalls.
- Importantly, even a single landfalling storm can define the season’s impact, reinforcing the need for preparedness regardless of averages.
Summary Table
| Metric | Forecast | 1991–2020 Average |
|---|---|---|
| Named Storms | 16 | 14.4 |
| Hurricanes | 8 | 7.2 |
| Major Hurricanes (Cat 3+) | 3 | 3.2 |
| ACE (Accumulated); total | 140 | 123 |
| ACE (west of 60°W) | 87 | 73 |
| U.S. Coast major hurricane probability | 48% | 43% |
Source: CSU / Colorado State University