I. Introduction
Weather is often treated as a backdrop in economic analysis, but its role is far more central than commonly acknowledged. From crop yields to transportation, energy demand to labor productivity, weather conditions influence every sector of the economy. In particular, weather can act as both a trigger and an amplifier of inflation. This long-form essay explores the many dimensions in which weather affects inflation and market cycles, examining historical patterns, scientific data, and emerging climate risks.
II. Defining Weather and Inflation
Weather refers to short-term atmospheric conditions, while climate describes long-term trends. Inflation, meanwhile, is the rate at which prices for goods and services rise, eroding purchasing power. These seemingly separate domains intersect profoundly through the economy’s sensitivity to natural conditions. When poor weather disrupts production or logistics, inflation often follows.

Source: https://econofact.org/the-perfect-storm-in-home-insurance
III. Agricultural Output and Weather Volatility
Agriculture is the most directly affected sector. Most food staples—wheat, rice, corn—are highly sensitive to temperature, rainfall, and seasonal shifts.
- Droughts reduce irrigation and devastate yields.
- Floods destroy planted fields and stored harvests.
- Heatwaves cause premature ripening or plant stress.
- Cold snaps kill blossoms and young crops.
These conditions create scarcity, leading to price spikes. For example, the 2010 Russian drought led to a ban on wheat exports, triggering global food inflation.

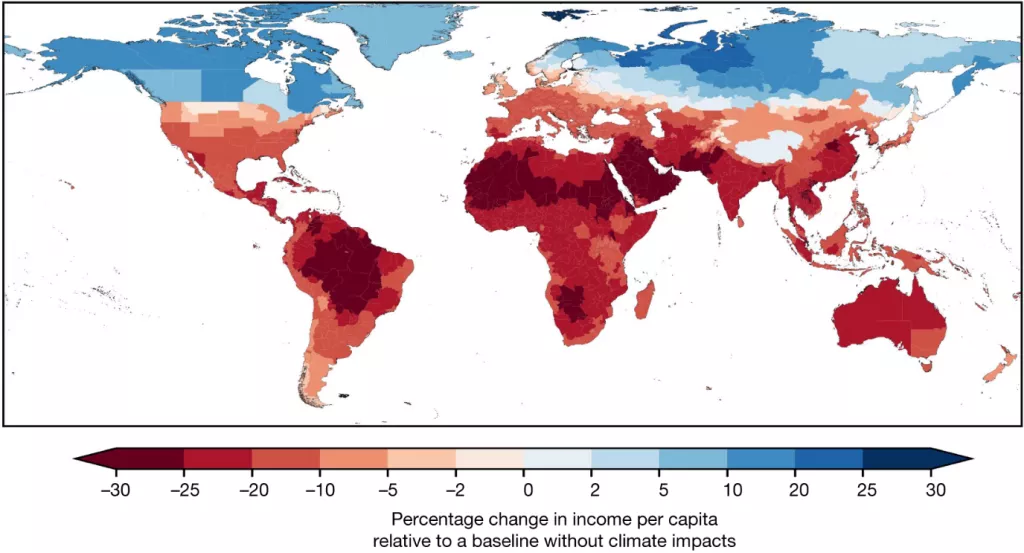
The pressure on annual inflation rates from the average temperature conditions projected under future climate change. Source: https://www.nature.com/articles/s43247-023-01173-x/figures/2
IV. Fertility and Long-Term Crop Cycles
Soil health, biodiversity, and pollination success are closely tied to local weather patterns. Repeated extremes can degrade fertility, lowering productivity even in years with average conditions. This reduces the resilience of food systems and increases volatility in food prices.
The El Niño–Southern Oscillation (ENSO) is a known cycle affecting global rainfall and temperatures. ENSO phases often predict agricultural conditions in regions like Southeast Asia, South America, and Sub-Saharan Africa, impacting global grain markets.
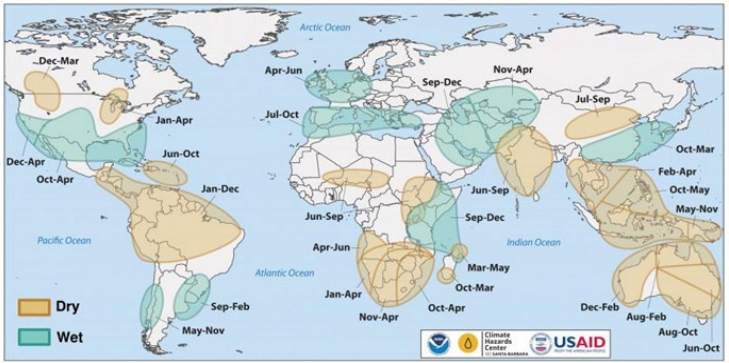
Source: Areas of dry and wet conditions during El Niño phase of ENSO. Source: NOAA, CHC, FEWSNET, https://static1.squarespace.com/static/636c12f7f9c2561de642a866/t/65677b2b611bca6582badcef/1701280555880/Special_Report_20230824_El_Nino.pdf
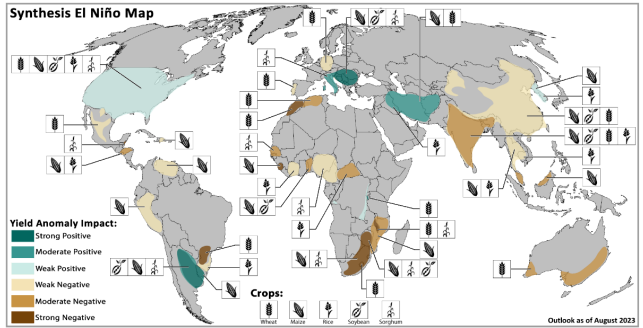
Source: Historical crop yield conditions during El Niño events for wheat, maize, rice, soybeans, and sorghum using
FAO country level yield data and ERSSTv5 from 1961-2020. In countries with more than one crop affected, the
color reflects the strongest effect, https://static1.squarespace.com/static/636c12f7f9c2561de642a866/t/65677b2b611bca6582badcef/1701280555880/Special_Report_20230824_El_Nino.pdf
V. Labor Productivity and Industrial Disruption
Extreme heat reduces labor productivity, particularly in outdoor jobs. For example, during heatwaves, construction and agricultural work often slow or halt altogether. Conversely, extreme cold raises heating costs and can impede manufacturing.
Energy-intensive industries suffer during extreme weather. High temperatures increase electricity use, straining grids and raising costs. Floods and storms damage facilities and disrupt logistics. These effects ripple across the supply chain, influencing inflationary pressures.
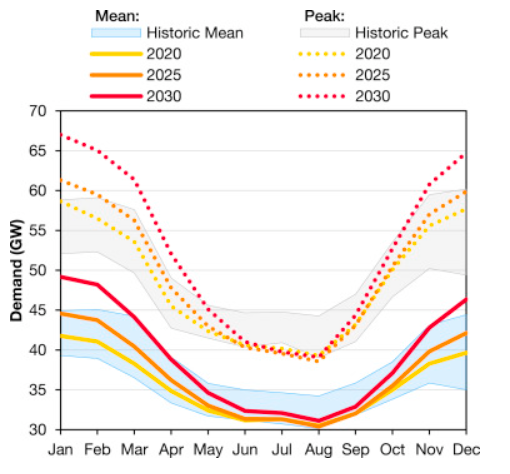
Source: The seasonal variation in historic and simulated future demand. Shaded areas show the historic range from 2005 to 15 while lines show simulations from three years averaged across all weather years. Dotted lines show peak demand within each month, solid lines show the mean. https://www.sciencedirect.com/science/article/pii/S0360544217320844
VI. Transportation and Supply Chain Vulnerability
Modern economies depend on seamless logistics. Roads, ports, and railways are vulnerable to extreme weather. Hurricane Katrina in 2005 disrupted oil refining and port activity, causing a spike in fuel prices. Recent floods in Europe and China similarly halted transport of goods and materials, causing delays and price hikes.
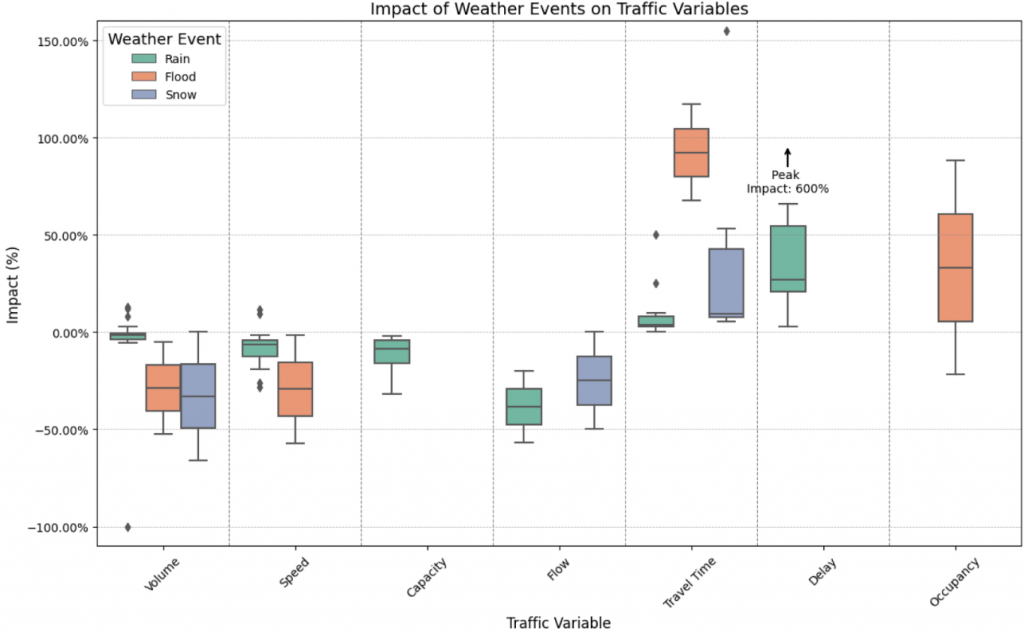
Impact of specific weather events on traffic variables, with diamonds indicating outliers.. Source: https://www.mdpi.com/2305-6290/9/1/32
VII. Energy Markets and Weather Sensitivity
Weather directly impacts energy demand:
- Cold = high demand for heating fuels (natural gas, oil)
- Heat = high demand for cooling (electricity)
Energy supply can also be weather-sensitive. Wind, solar, and hydro are increasingly important but depend on local conditions. Drought reduces hydroelectric output; calm or cloudy days impact wind and solar.
Energy inflation, in turn, feeds into transport and manufacturing costs, reinforcing general price inflation.
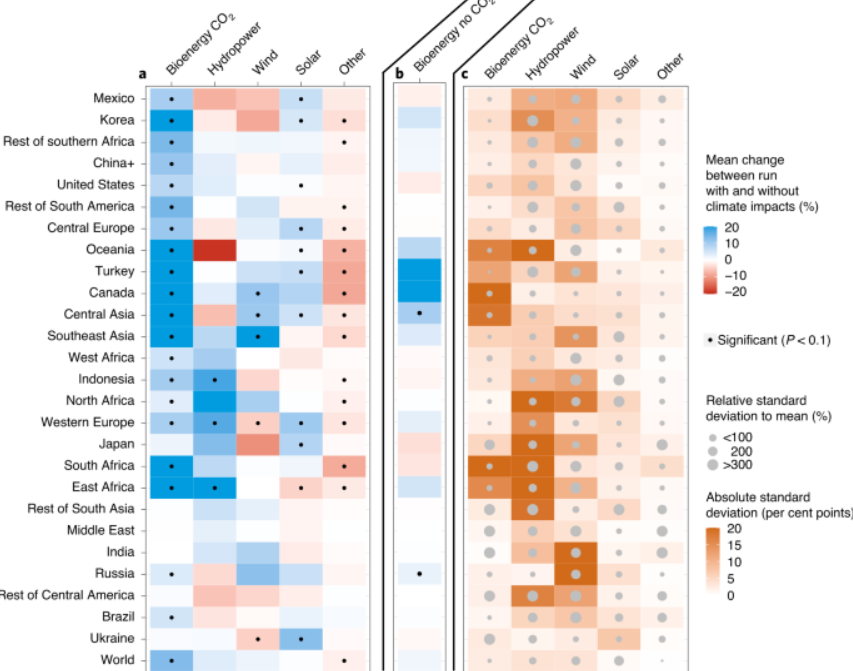
Source: https://www.nature.com/articles/s41558-020-00949-9
VIII. Financial Markets and Climate Correlations
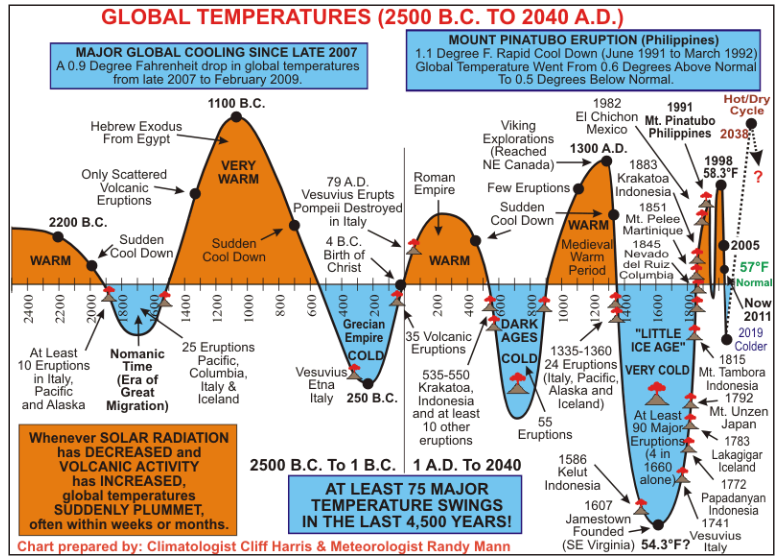
Historically, there are correlations between climate anomalies and market downturns. The Little Ice Age (1300–1850) saw poor harvests, famines, and unrest. The 1816 “Year Without a Summer”, caused by a volcanic eruption, led to global crop failures and economic depression.
Recent studies have found links between El Niño events and commodity price surges. Analysts now consider weather patterns in financial risk models, particularly for agri-commodities, insurance, and emerging markets.

IX. Inflation Spikes from Weather Shocks
Weather shocks lead to sudden, localized supply constraints. These create price spikes, especially for essentials. If prolonged or widespread, they cause general inflation. For instance:
- 2021–2022: Droughts in South America affected coffee and soy.
- 2023: European heatwaves hit olive oil and grape production.
- 2024: Monsoon failure in India raised rice prices globally.
Central banks often label these “transitory” shocks, but repeated events stretch that term’s meaning.
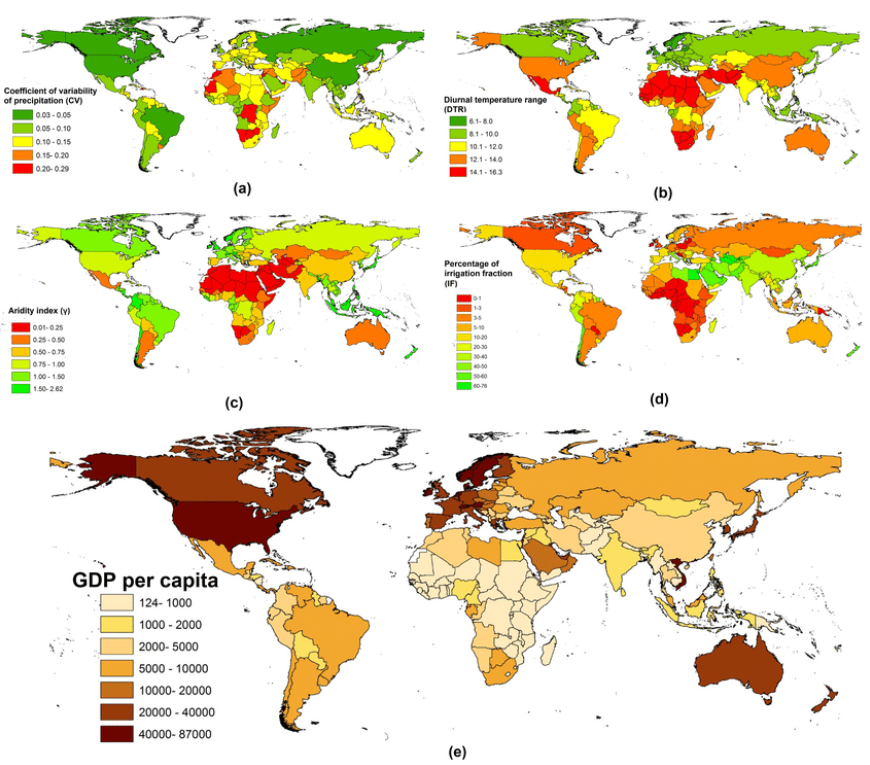
(a) global map of precipitation variability from 1961 to 2012, (b) global map of mean diurnal temperature range from 1960-1990, (c) global map of mean aridity spanning 1950 to 2000, (d) global map of fraction of cropland areas equipped for irrigation ,(e) GDP per capita in 2013. Source: https://www.researchgate.net/figure/a-global-map-of-precipitation-variability-from-1961-to-2012-b-global-map-of-mean_fig4_323331126
X. The Role of Insurance and Risk Transfer
Agricultural and climate insurance can buffer financial shocks, but not eliminate them. Insurance firms raise premiums after disasters, increasing costs for farmers and businesses. Reinsurance markets are also affected, raising systemic risks in financial markets.
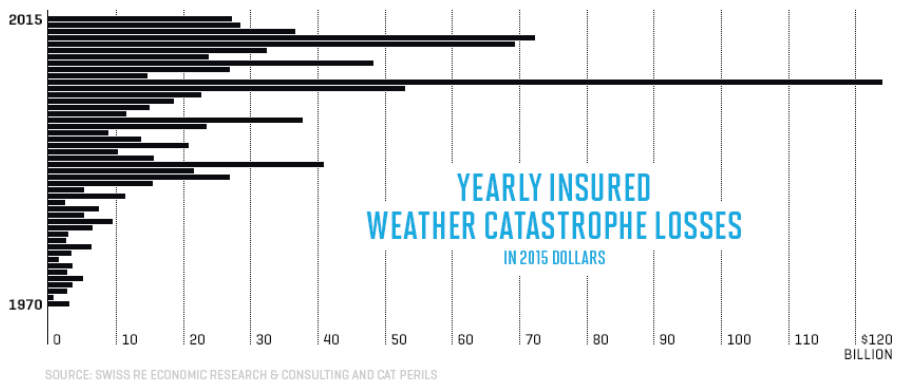
Source: https://fortune.com/2016/08/23/munich-re-disaster-insurance/
XI. Market Cycles and Climate Patterns
Some analysts propose that climate shifts synchronize with economic supercycles:
- Warmer periods align with growth and expansion.
- Colder periods align with famine, recession, and inflation.
While these claims are debated, long-term historical data show recurring crises during periods of climatic stress.
XII. Climate Change and Inflation Risk in the 21st Century
Climate change magnifies all weather risks:
- More frequent droughts and floods
- Longer heatwaves
- Stronger storms
These trends threaten to make inflation less predictable and harder to control. In developing countries, climate-related inflation is already a chronic issue. Even in advanced economies, food, energy, and insurance inflation are increasingly tied to weather extremes.
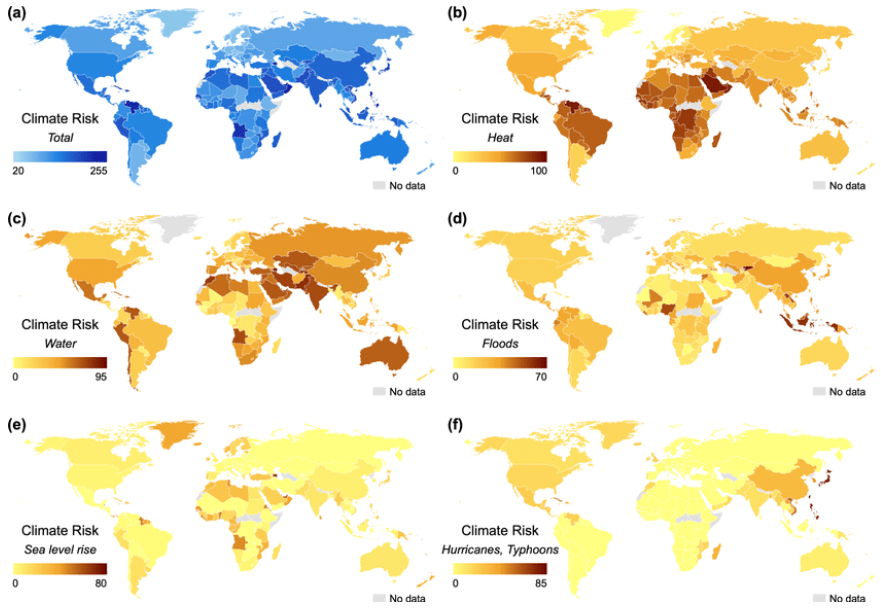
Average climate risk scores of overseas facilities by host country Analysis based on climate risk scores and facility statistics of 2233 public companies from Four Twenty Seven. The map images are created by the authors using ArcGIS. (a) Aggregate climate risk score, (b) heat stress score, (c) water stress score, (d) floods score, (e) sea level rise score, (f) hurricanes/typhoons score.XIII. Social Unrest and Political Instability. Source: https://www.researchgate.net/figure/Average-climate-risk-scores-of-overseas-facilities-by-host-country-Analysis-based-on_fig3_359336463
Price spikes in food and energy often precede social unrest. Historical examples include:
- The French Revolution, preceded by grain inflation
- The Arab Spring, triggered partly by food price spikes
Weather-driven inflation may contribute to geopolitical instability, especially where governance is weak.

Source: https://www.hearstnetworks.com/
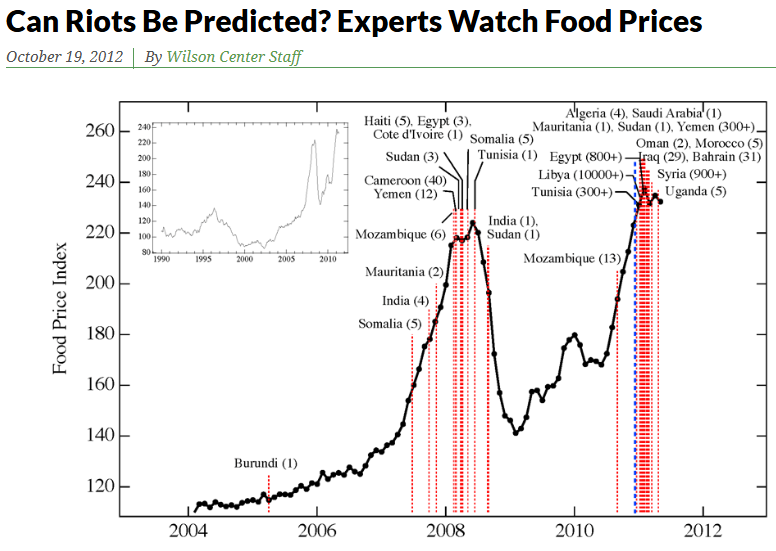
Source: https://www.newsecuritybeat.org/2012/10/riots-predicted-experts-watch-food-prices/
XIV. Building Resilience and Policy Tools
Policy responses to weather-related inflation include:
- Strategic food and fuel reserves
- Improved forecasting and early warning systems
- Climate-resilient infrastructure
- Subsidies or targeted relief for affected populations
Central banks may also need to incorporate climate risk into their inflation models and consider more flexible policy tools.
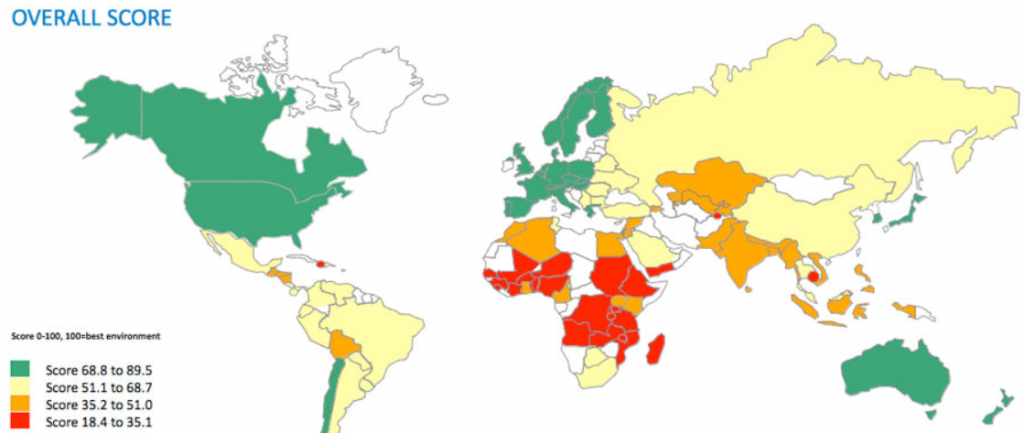
Green represents the best environment and red the worst for food security according to food security index in 2012. Source: https://www.theguardian.com/news/datablog/2012/jul/10/food-security-index
XV. Conclusion
Weather is more than background noise to the economy; it is a dynamic and unpredictable force that can drive inflation, reshape market cycles, and challenge political stability. As climate variability increases, so too will the relevance of weather in economic planning and monetary policy. Understanding these relationships is no longer optional—it is essential for governments, businesses, and individuals navigating the 21st-century economy.
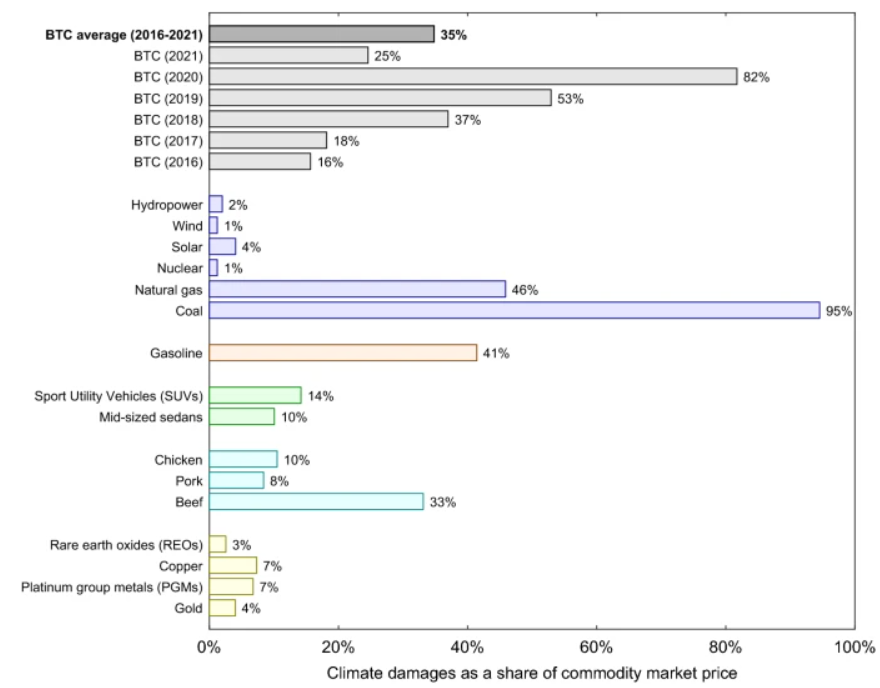
Bitcoin (BTC) mining’s climate damages as a share of coin market price (2016–2021), compared with full lifecycle analysis climate damages as a share of market price for other commodities (for a single year). Source: https://www.nature.com/articles/s41598-022-18686-8

