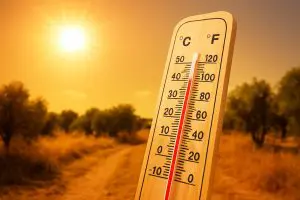
November heatwave ended by floods in North Carolina and Virginia, 6 dead
Last warmer days along east coast of the USA and Canada – Wednesday and Thursday, 11.-12. November 2020 have been associated with lot of humidity and tropical downpours on a cold front, which ended up long Indian summer period lasting almost since the start of November 2020.
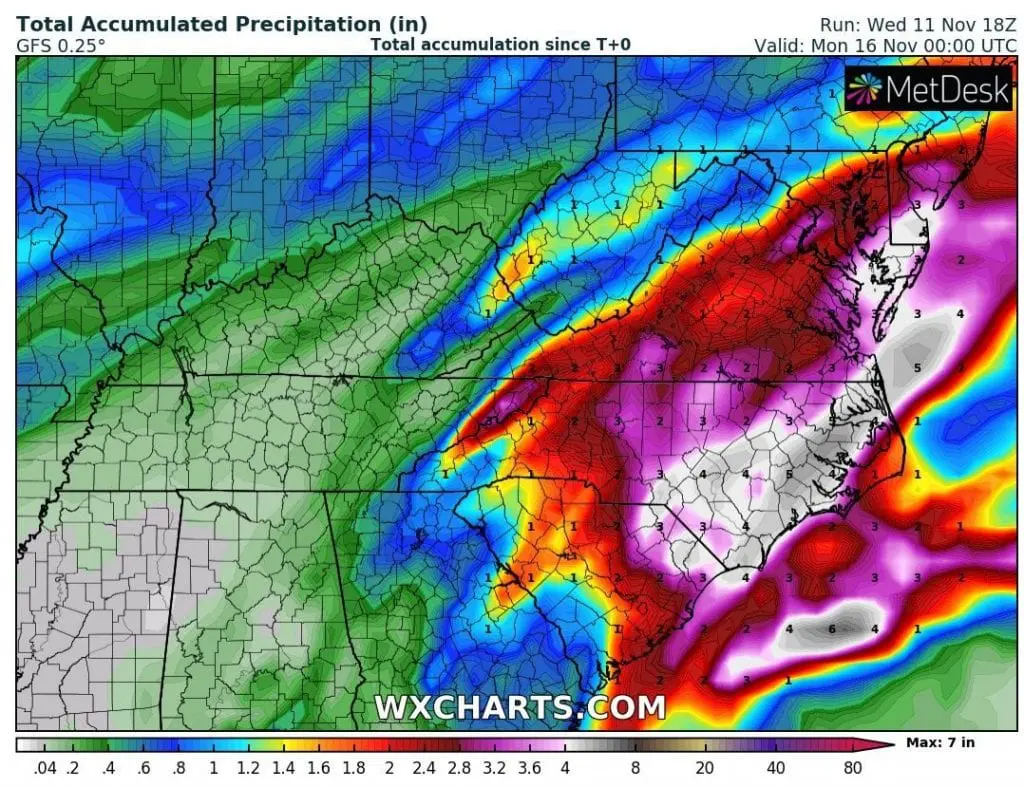
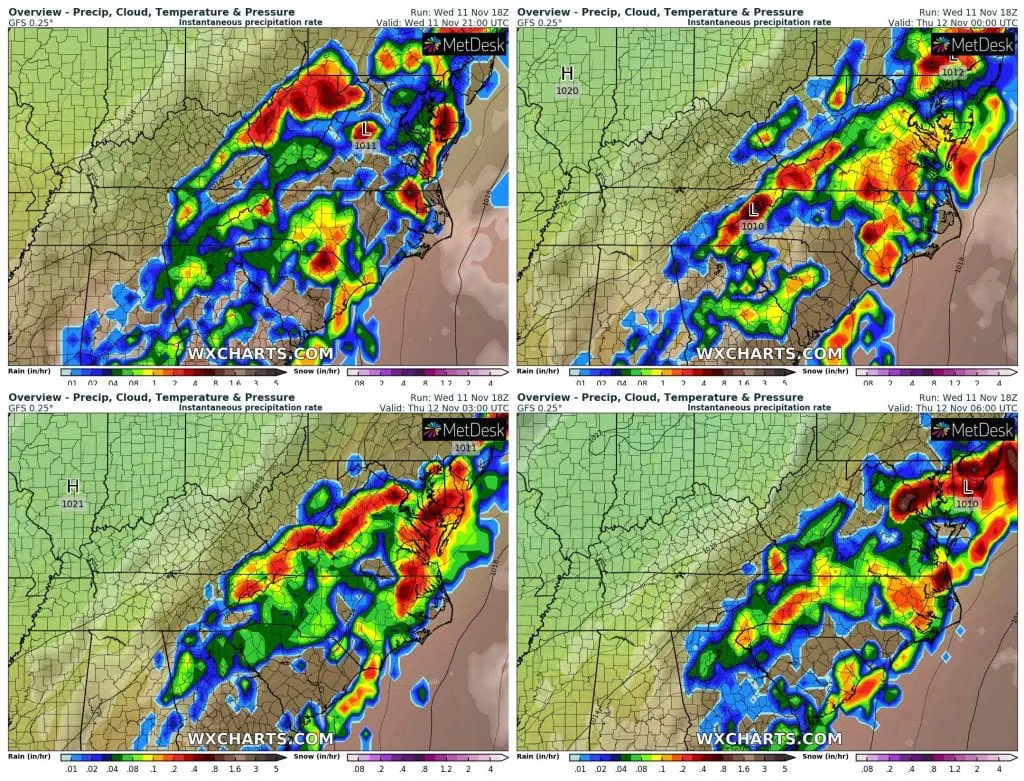
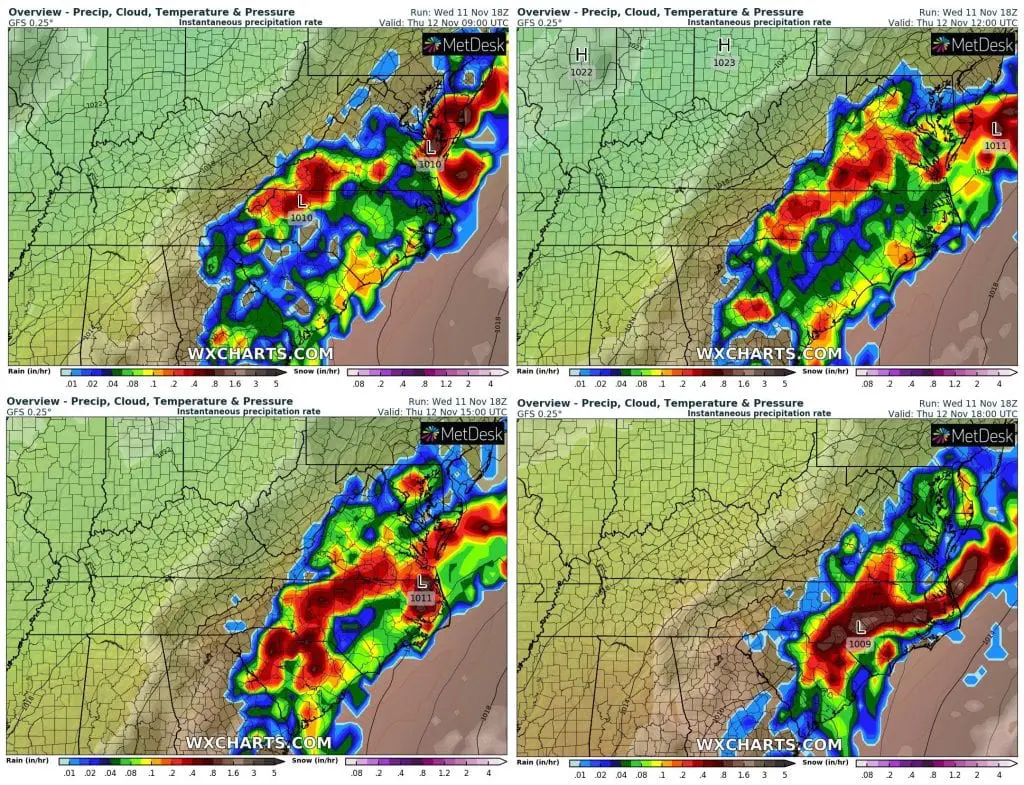
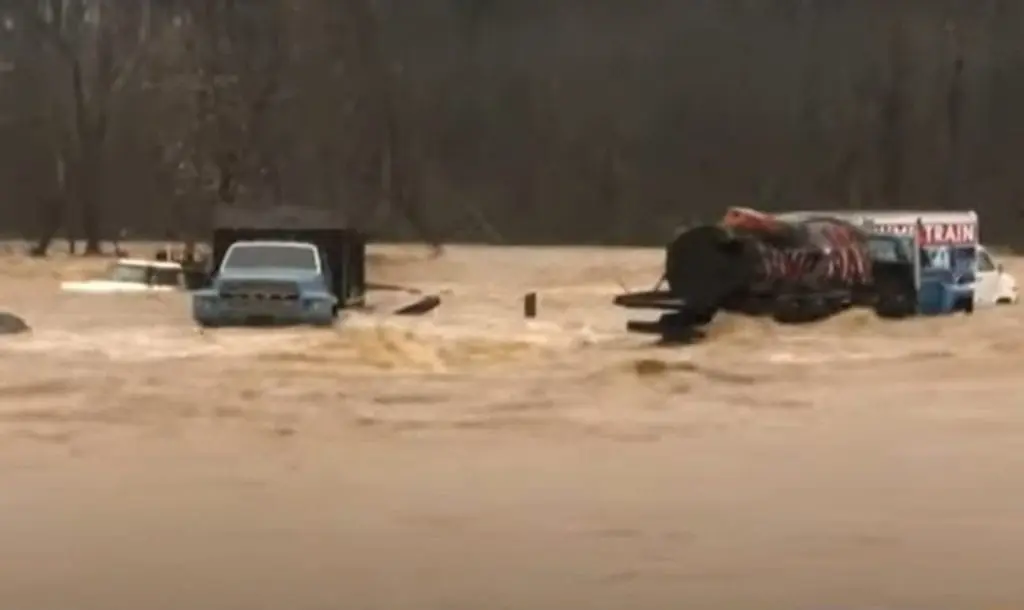
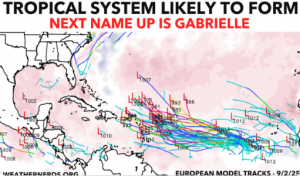
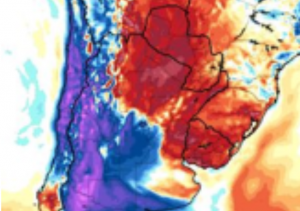
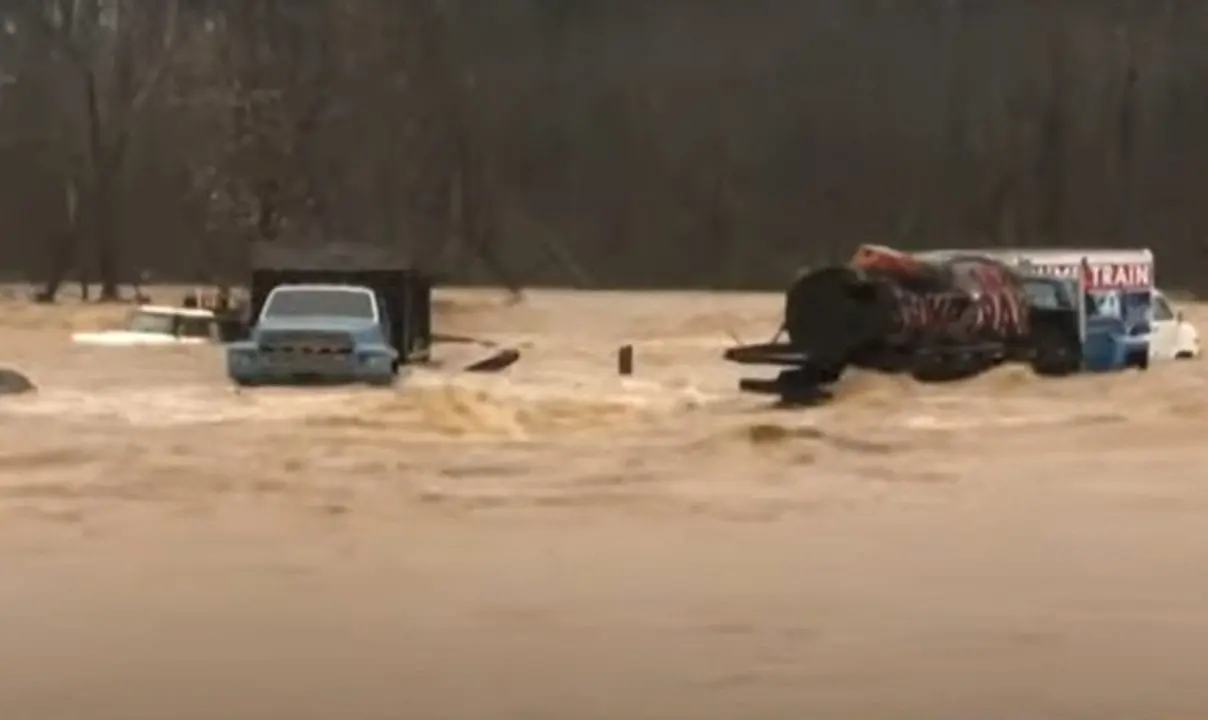
The worst situation was in North Carolina and Virginia, where cold front, which is linking with ex-hurricane Eta, has brought floods, mainly around Charlotte, North Carolina, where the strongest, red radar reflections were observed. Floods in Charlotte have caused 6 deaths.
In cities in Northeast wasn´t so hot as from Saturday to Tuesday /https://mkweather.com/2020/11/10/so-warm-in-november-last-time-before-70-years-1950-summer-days-in-detroit-baltimore-indianapolis/; https://mkweather.com/2020/11/07/tropical-indian-summer-in-november-north-platte-in-nebraska-306c-87-1f/; https://mkweather.com/2020/10/27/after-historic-october-coldwaves-long-period-of-indian-summer-in-northern-usa-and-southern-canada-between-2-10-november-temperatures-regionally-more-than-20c-above-long-term-averages/; https://mkweather.com/2020/11/08/new-york-summer-in-november-76f-244c//, but several places reported above 68°C on Wednesday – Ingonish Beach in Canada, +24,9°C / 76.8°F, Providence and Atlantic City, +23,3°C / 73.9°F, Boston +22,9°C / 73.2°F, Erie +22,2°C / 72°F, Philadelphia +21,7°C / 71.1°F, Baltimore, New York City and Washington D.C. +21,1°C / 70°F, Buffalo +20,6°C / 69.1°F or Cleveland +20,0°C / 68°F.
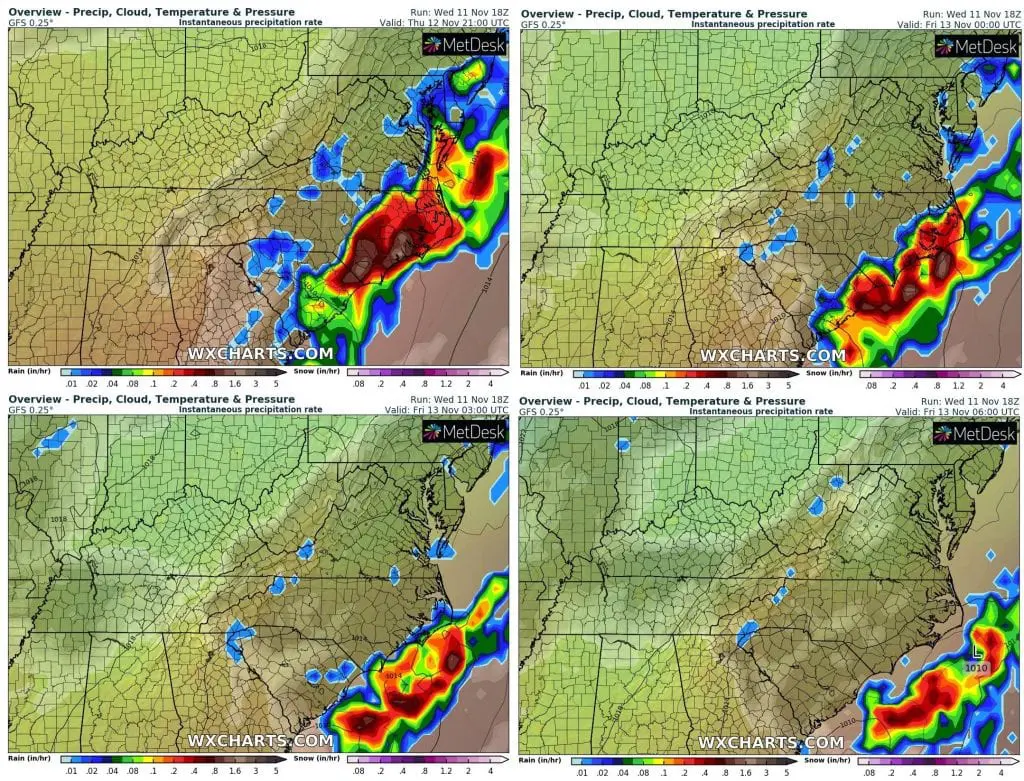
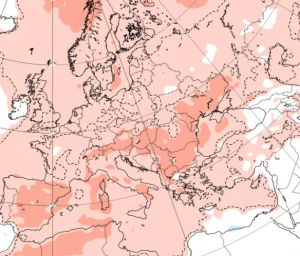
Powerful cold front with ex-hurricane Eta in its southern edge will be shifting during last days across North Atlantic towards British Islands, where bring heavy rain and winds.
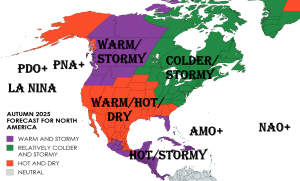
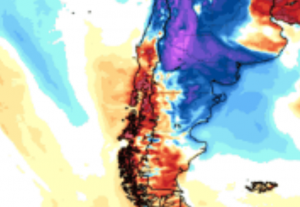
After transition of cold front, weather extremes over the USA for a shorter time will be more equal and since the weekend, next coldwave will start in northern half of the USA. Next 2 coldwaves are projected for the USA during the 3rd decade of November 2020, therefore it should be with early cold blasts relatively good.
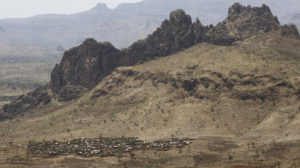
Materials below are describing a flood situation in Southeast.
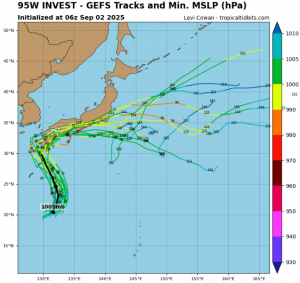
Infographics: meteologix.com, wxcharts.com, Youtube: