TOP 20 La nina winter precipitation patterns since 1950 in the USA / NOAA
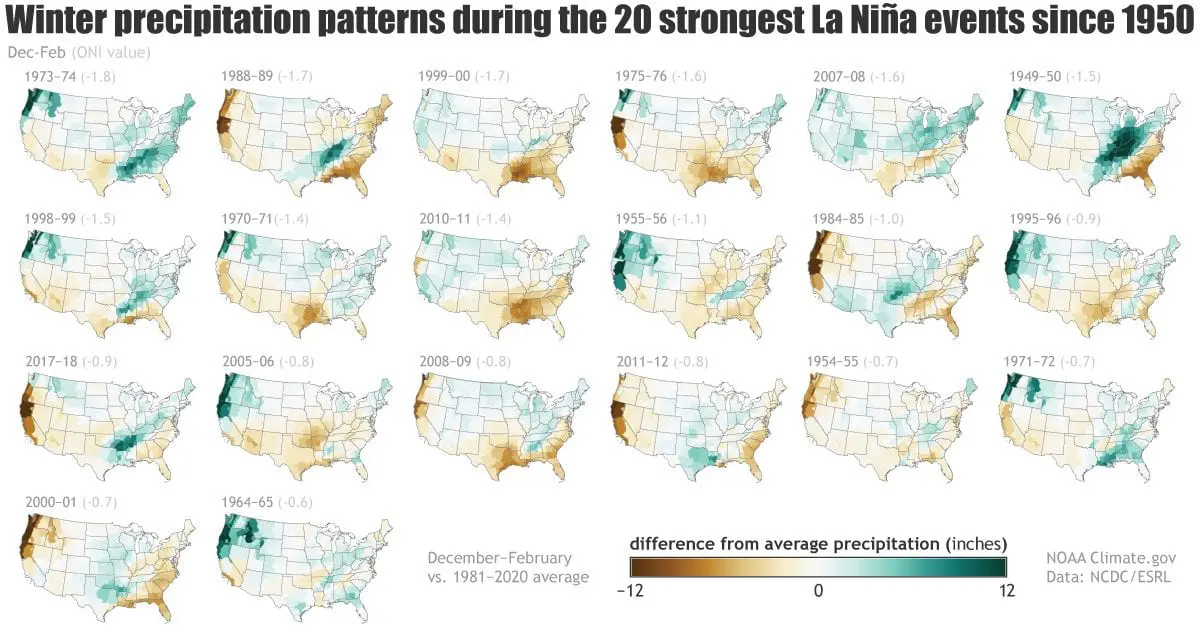
NOAA has published a report with maps of Winter precipitation patterns during 20 strongest La nina events since 1950.
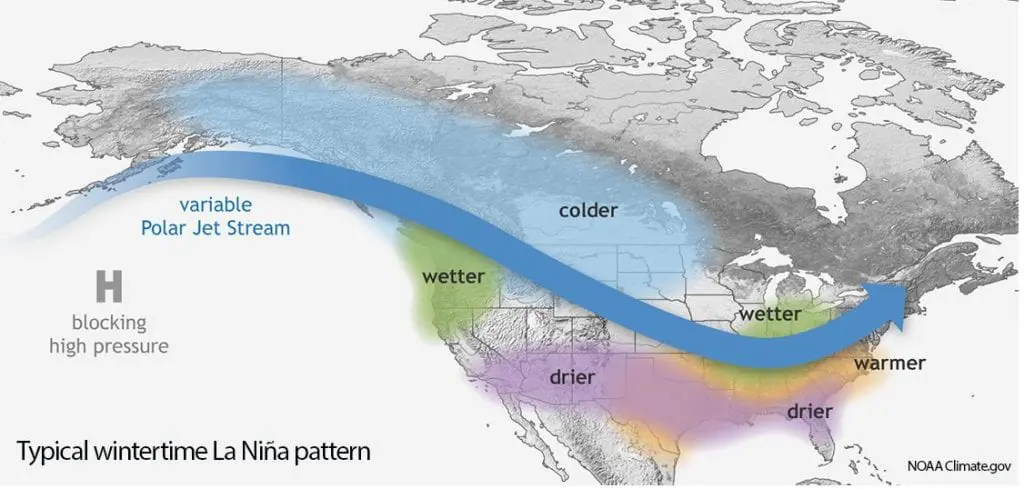
We should compare these outputs with an average behavior of La nina in the USA.
In the most cases, very rainy / snowy Northwest has appeared with ratio 13:7 (wet:dry).
Too, dry southern USA are linked with La nina conditions. These contours have more than a half of La-nina years on the maps, lot of years have been chaotic, with drier one part of southern US and rainy other parts.
Relatively often is during La nina rainy and wet region around Great Lakes / Upper Midwest, what we should seen approximately on half TOP 20 winter La nina outputs below.
Relatively higher probability during La nina is drier Southeast and Mid-Atlantic, too, but this pattern has more chaotic behaviour.
Northern USA are often precipitation-neutral during La-nina, or very slightly above average, with relatively good probability of snowfall in the center of Polar jet-stream flow.
These conditions are more often associated with AO+ phase and PNA- pattern, but it isn´t a rule.
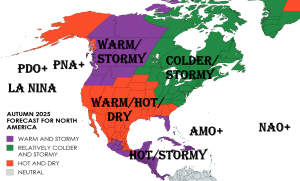
Since La-nina phase since the end of September is valid, precipitation patterns approximately behave according to scheme described above and on summary map below.
Infographics: