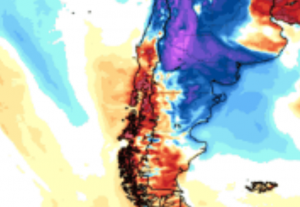
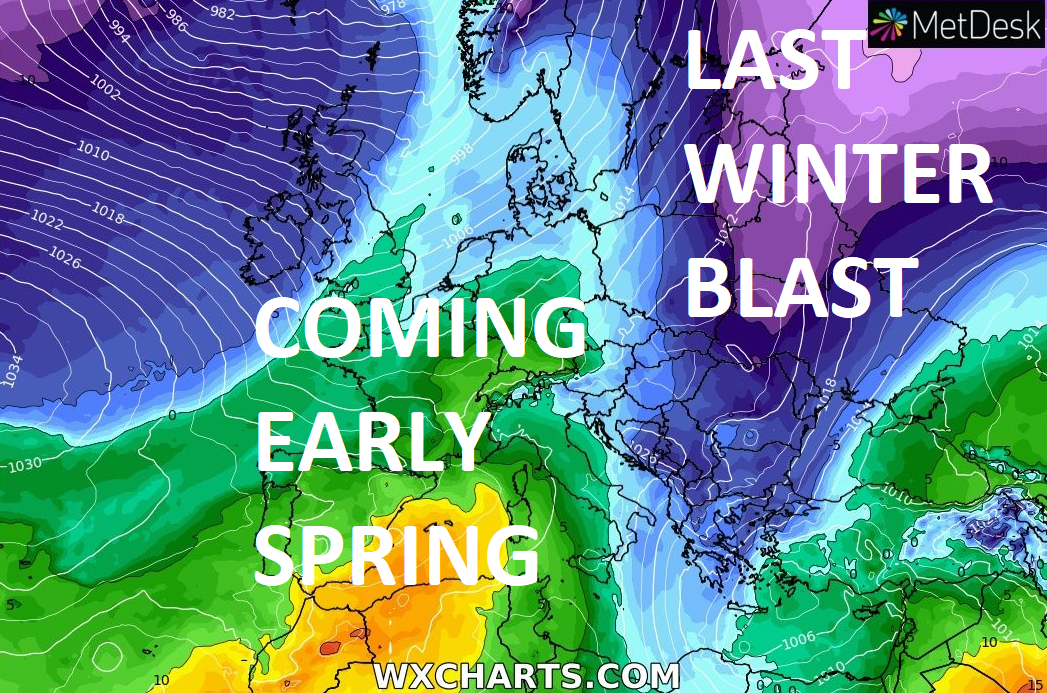
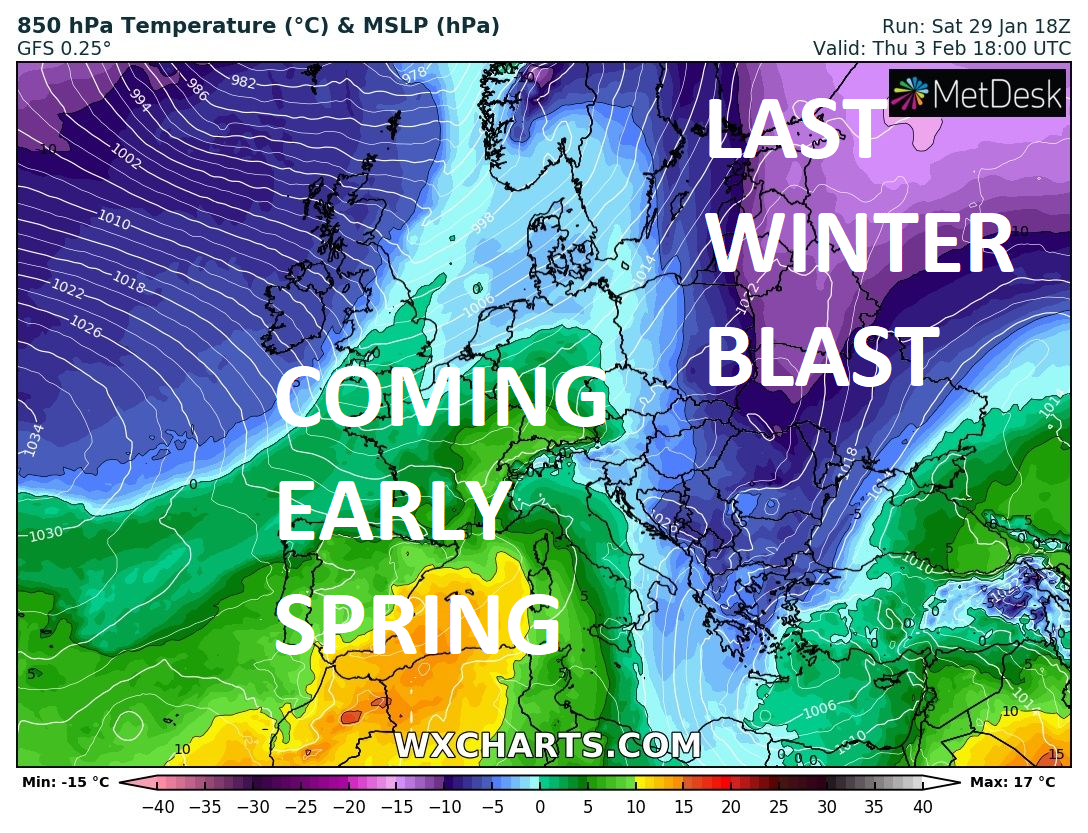
The last strong Arctic blast should hit the eastern half of Europe around 4.-6. February 2022: Frosts below -30°C for Finland and below -20°C for Baltic countries, Belarus, Ukraine, or Romania!
After Orkan Nadia, which is bringing severe wind gusts up to 130 km/h to European metropolitan cities /https://mkweather.com/breaking-orkan-nadia-hit-budapest-with-130-km-h-winds-above-100-km-h-hamburg-vienna-innsbruck-copenhagen-malmo-lodz-usti-nad-labem-glasgow-or-edinburgh-too//, will flood mainly eastern half of Europe in the next period again extremely cold air.
The worst situation with frosts should be around 4.-6. February 2022 and it should be the last severe frosts in Europe in the winter season 2021/2022, because, early-spring weather already between 6.-14. February 2022 is already confirming (the next Mkweather article).
The worst frosts are forecasted in Finland (below -30°C, maybe -35°C), the Baltic states, Belarus, Ukraine, and Romania (below -20°C), so far.
Partially will be hit Balkan, the Alps, and the Carpathians and very cold weather will stay in Turkey and the northern Middle East.
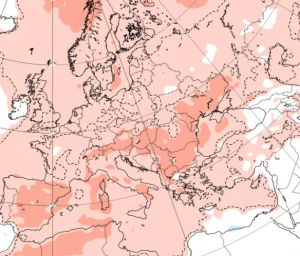
Parts of Eastern Europe, less Balkan and Central Europe, and too Turkey and mountains along Eastern Mediterranean coast, expect the next snowfall, in Eastern Europe relatively higher /map here: https://mkweather.com/tuapse-black-sea-region-russia-extreme-164-cm-snowfall-activities-outside-are-totally-impossible//.
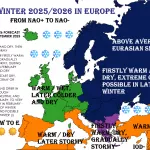
Near strong NAO+ between 13.-27. February and then in March 2022, extreme and persisting Arctic blasts in Europe are quite improbable /https://mkweather.com/early-spring-should-be-peaking-around-13-27-february-2022-nao-in-march-2022-will-be-even-warmer/; https://mkweather.com/ecmwf-forecast-for-europe-until-14-march-2022-early-spring-for-the-british-islands-scandinavia-continental-europe-and-iberia//.
The first early-spring period is currently forecasted already after this, the last probable extreme cold blast, gradually from western Europe around 6. February to Eastern Europe and Turkey around 12.-14. February 2022.
On the early-spring forecast for Europe, we will look already in the next Mkweather article and soon will be updated 6-week NAO(+), temperature, and precipitation forecasts from ECMWF.
Source: wxcharts.com
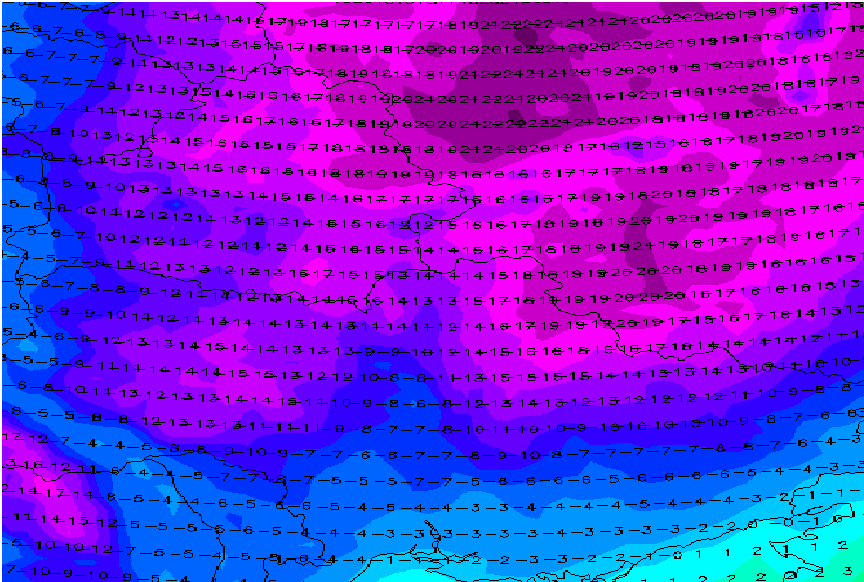
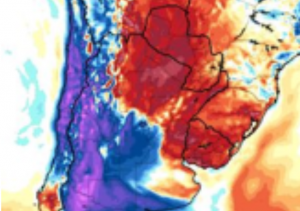
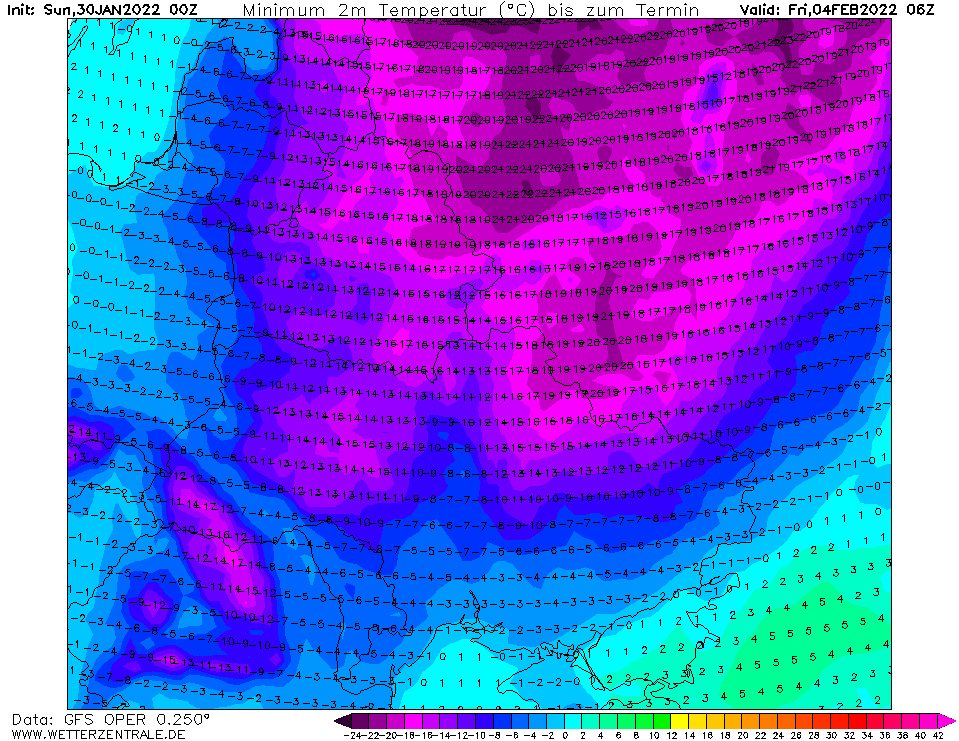
Illustration map. Source: wettezrentrale.de
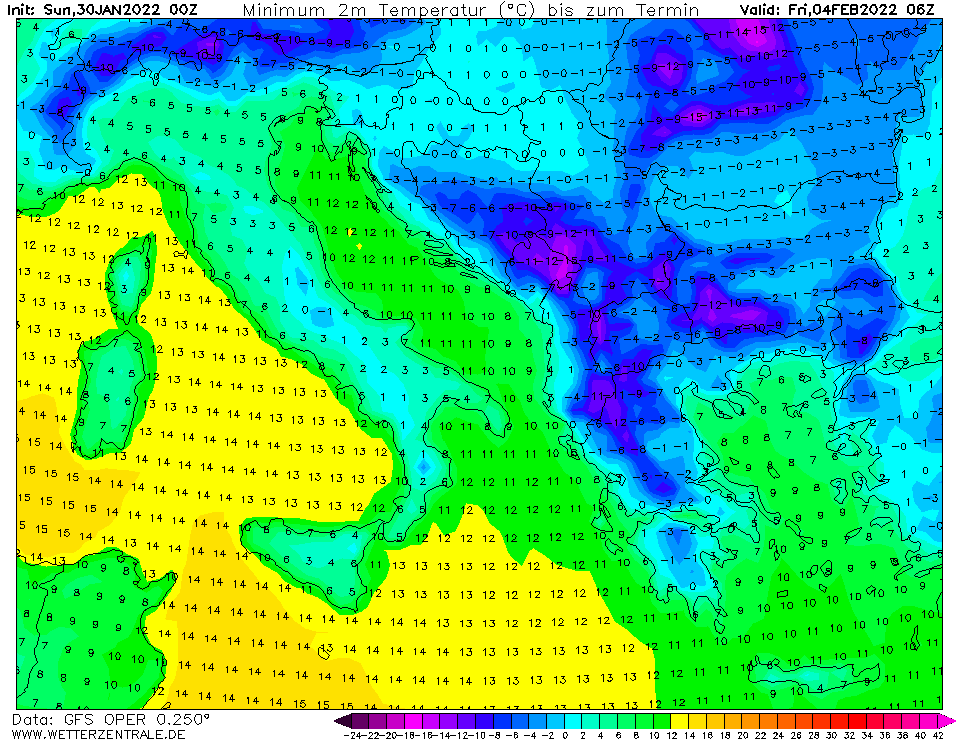
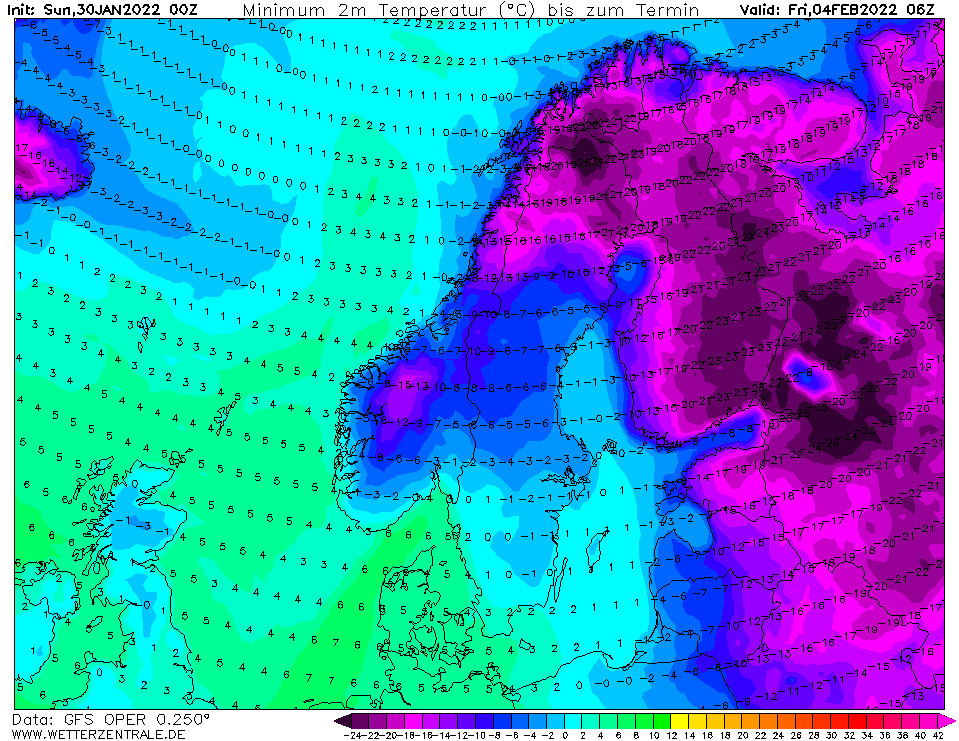
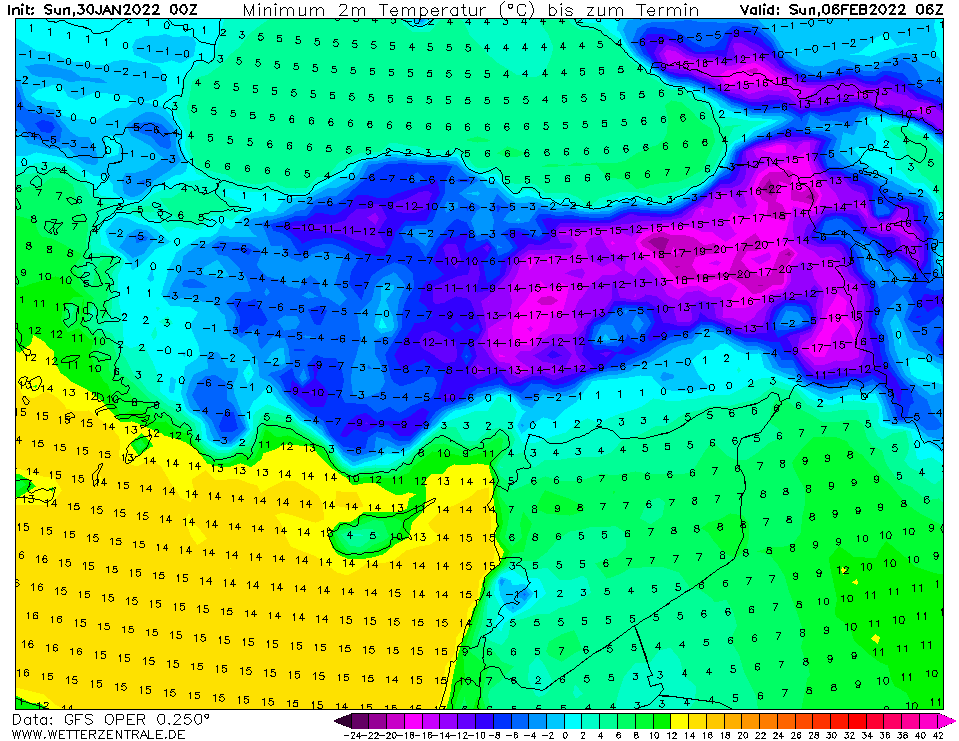
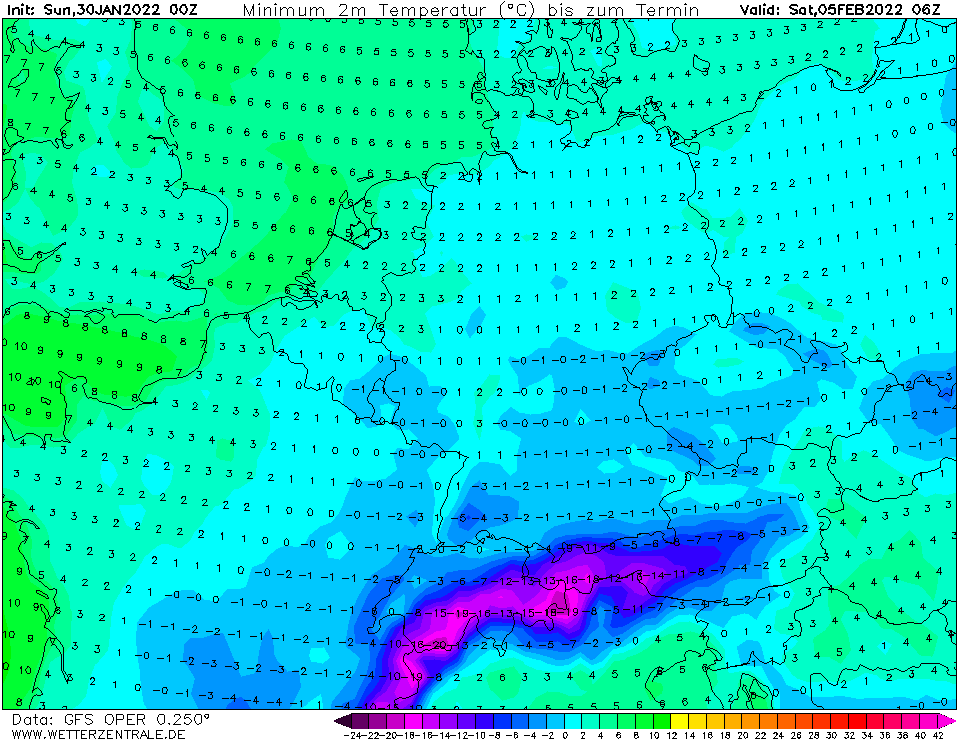
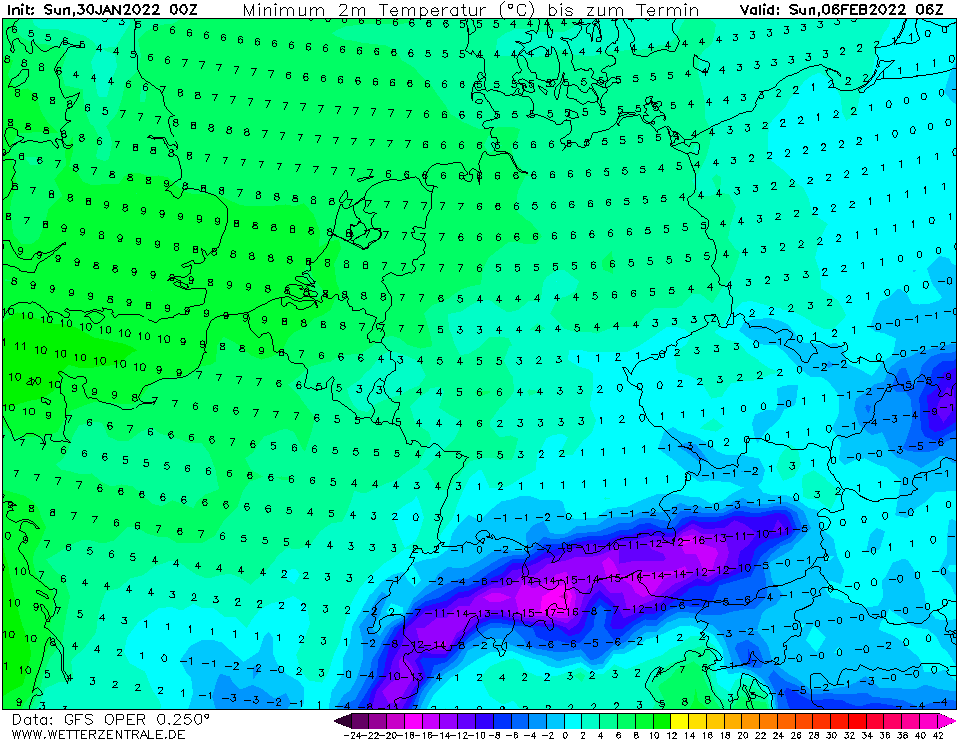
Source: wetterzentrale.de